Temperature chart for a single-pipe hot water system. Substantiation of the reduced temperature schedule for regulation of centralized heat supply systems
There are certain patterns by which the temperature of the coolant in central heating changes. In order to adequately trace these fluctuations, there are special graphs.
Reasons for temperature changes
To begin with, it is important to understand a few points:
- When weather conditions change, this automatically entails a change in heat loss. With the onset of cold weather, an order of magnitude more thermal energy is spent to maintain an optimal microclimate in the home than during the warm period. At the same time, the level of consumed heat is not calculated by the exact temperature of the outdoor air: for this, the so-called. "delta" of the difference between the street and the interior. For example, +25 degrees in an apartment and -20 outside its walls will entail exactly the same heat costs as at +18 and -27, respectively.
- The constancy of the heat flow from the radiators is ensured by a stable temperature of the coolant. With a decrease in the temperature in the room, a certain rise in the temperature of the radiators will be observed: this is facilitated by an increase in the delta between the coolant and the air in the room. In any case, this will not be able to adequately compensate for the increase in heat loss through the walls. This is explained by the setting of restrictions for the lower temperature limit in the dwelling by the current SNiP at the level of + 18-22 degrees.
It is most logical to solve the problem of increasing losses by increasing the temperature of the coolant. It is important that its increase occurs in parallel with the decrease in air temperature outside the window: the colder it is, the greater the heat loss needs to be replenished. To facilitate orientation in this matter, at some stage it was decided to create special tables for reconciling both values. Based on this, we can say that the temperature graph of the heating system means the derivation of the dependence of the level of water heating in the supply and return pipelines in relation to the temperature regime on the street.
Features of the temperature graph
The above charts come in two varieties:
- For heating networks.
- For the heating system inside the house.

To understand how both of these concepts differ, it is advisable to first understand the features of the operation of centralized heating.
Link between CHP and heating networks
The purpose of this combination is to communicate the proper level of heating to the coolant, with its subsequent transportation to the place of consumption. Heating mains usually have a length of several tens of kilometers, with total area surface area of tens of thousands of square meters. Although the main networks are subjected to thorough thermal insulation, it is impossible to do without heat losses.
In the direction of travel between the CHP (or boiler house) and residential premises, there is some cooling of process water. The conclusion itself suggests itself: in order to convey to the consumer an acceptable level of heating of the coolant, it must be supplied inside the heating main from the CHP in the most heated state. The temperature swing is limited by the boiling point. It can be shifted in the direction of increasing temperature if the pressure in the pipes is increased.

The standard pressure indicator in the supply pipe of the heating main is in the range of 7-8 atm. This level, despite the loss of pressure during the transportation of the coolant, makes it possible to ensure the efficient operation of the heating system in buildings up to 16 floors high. In this case, additional pumps are usually not needed.
It is very important that such pressure does not pose a danger to the system as a whole: routes, risers, pipes, mixing hoses and other components remain operational for a long time. Given a certain margin for the upper limit of the supply temperature, its value is taken as +150 degrees. The passage of the most standard temperature curves for the supply of coolant to the heating system takes place between 150/70 - 105/70 (supply and return temperatures).
Features of the supply of coolant to the heating system
The house heating system is characterized by a number of additional restrictions:
- The value of the highest heating of the coolant in the circuit is limited to +95 degrees for a two-pipe system and +105 for a single-pipe heating system. It should be noted that preschool educational institutions are characterized by the presence of more stringent restrictions: there the temperature of the batteries should not rise above +37 degrees. To compensate for such a decrease in the supply temperature, it is necessary to increase the number of radiator sections. Interior spaces kindergartens located in regions with particularly severe climatic conditions are literally crammed with batteries.
- It is desirable to achieve a minimum temperature delta of the heating supply schedule between the supply and return pipelines: otherwise, the degree of heating of the radiator sections in the building will have a large difference. To do this, the coolant inside the system must move as quickly as possible. However, there is a danger here: due to the high speed of water circulation inside the heating circuit, its temperature at the outlet back to the route will be unnecessarily high. As a result, this can lead to serious violations in the operation of the CHP.

Influence of climatic zones on outdoor temperature
The main factor that directly affects the preparation of the temperature schedule for the heating season is the estimated winter temperature. In the course of compilation, they try to ensure that highest values(95/70 and 105/70) at maximum frosts guaranteed the required SNiP temperature. The outdoor temperature for calculating heating is taken from a special table climatic zones.

Adjustment features
The parameters of thermal routes are in the area of responsibility of the management of CHPPs and heating networks. At the same time, ZhEK employees are responsible for the network parameters inside the building. Basically, residents' complaints about the cold relate to downward deviations. Situations are much less common when measurements inside thermal units indicate an increased return temperature.
There are several ways to normalize system parameters that you can implement yourself:
- Nozzle reaming. The problem of lowering the temperature of the liquid in the return can be solved by expanding the elevator nozzle. To do this, you need to close all the valves and valves on the elevator. After that, the module is removed, its nozzle is pulled out and reamed by 0.5-1 mm. After assembling the elevator, it is launched to bleed air in the reverse order. Paronite seals on the flanges are recommended to be replaced with rubber ones: they are made according to the size of the flange from the automobile chamber.
- Suction suppression. In extreme cases (with the onset of ultra-low frosts), the nozzle can be dismantled altogether. In this case, there is a threat that the suction will begin to perform the function of a jumper: in order to prevent this, it is jammed. For this, a steel pancake with a thickness of 1 mm is used. This method is an emergency, because this can provoke a jump in battery temperature up to +130 degrees.
- Delta control. A temporary way to solve the problem of temperature rise is to correct the differential with an elevator valve. To do this, it is necessary to redirect the DHW to the supply pipe: the return pipe is equipped with a pressure gauge. The inlet valve of the return pipeline is completely closed. Next, you need to gradually open the valve, constantly checking your actions with the readings of the pressure gauge.
Just a closed valve can cause a shutdown and defrosting of the circuit. The decrease in the difference is achieved due to an increase in the return pressure (0.2 atm./day). The temperature in the system must be checked every day: it must correspond to the heating temperature curve.
Looking through the statistics of visiting our blog, I noticed that search phrases such as, for example, “what should be the temperature of the coolant at minus 5 outside?” appear very often. I decided to lay out the old schedule for the quality regulation of heat supply based on the average daily outdoor temperature. I want to warn those who, on the basis of these figures, will try to sort things out with housing departments or heating networks: heating schedules for each individual settlement are different (I wrote about this in the article regulating the temperature of the coolant). Work on this schedule heating network in Ufa (Bashkiria).
I also want to draw attention to the fact that regulation takes place according to the average daily outdoor temperature, so if, for example, it is minus 15 degrees outside at night and minus 5 during the day, then the coolant temperature will be maintained in accordance with the schedule at minus 10 °C.
As a rule, the following temperature graphs are used: 150/70, 130/70, 115/70, 105/70, 95/70. The schedule is selected depending on the specific local conditions. House heating systems operate according to schedules 105/70 and 95/70. According to schedules 150, 130 and 115/70, main heat networks operate.
Let's look at an example of how to use the chart. Suppose the temperature outside is minus 10 degrees. Heating networks operate according to a temperature schedule of 130/70, which means that at -10 ° C the temperature of the coolant in the supply pipeline of the heating network should be 85.6 degrees, in the supply pipeline of the heating system - 70.8 ° C with a schedule of 105/70 or 65.3 ° C at chart 95/70. The water temperature after the heating system should be 51.7 °C.
As a rule, the temperature values in the supply pipeline of heat networks are rounded off when setting the heat source. For example, according to the schedule, it should be 85.6 ° C, and 87 degrees are set at the CHP or boiler house.
| 53,2 | 50,2 | 46,4 | 43,4 | 41,2 | 35,8 |
| 55,7 | 52,3 | 48,2 | 45,0 | 42,7 | 36,8 |
| 58,1 | 54,4 | 50,0 | 46,6 | 44,1 | 37,7 |
| 60,5 | 56,5 | 51,8 | 48,2 | 45,5 | 38,7 |
| 62,9 | 58,5 | 53,5 | 49,8 | 46,9 | 39,6 |
| 65,3 | 60,5 | 55,3 | 51,4 | 48,3 | 40,6 |
| 67,7 | 62,6 | 57,0 | 52,9 | 49,7 | 41,5 |
| 70,0 | 64,5 | 58,8 | 54,5 | 51,0 | 42,4 |
| 72,4 | 66,5 | 60,5 | 56,0 | 52,4 | 43,3 |
| 74,7 | 68,5 | 62,2 | 57,5 | 53,7 | 44,2 |
| 77,0 | 70,4 | 63,8 | 59,0 | 55,0 | 45,0 |
| 79,3 | 72,4 | 65,5 | 60,5 | 56,3 | 45,9 |
| 81,6 | 74,3 | 67,2 | 62,0 | 57,6 | 46,7 |
| 83,9 | 76,2 | 68,8 | 63,5 | 58,9 | 47,6 |
| 86,2 | 78,1 | 70,4 | 65,0 | 60,2 | 48,4 |
| 88,5 | 80,0 | 72,1 | 66,4 | 61,5 | 49,2 |
| 90,8 | 81,9 | 73,7 | 67,9 | 62,8 | 50,1 |
| 93,0 | 83,8 | 75,3 | 69,3 | 64,0 | 50,9 |
| 95,3 | 85,6 | 76,9 | 70,8 | 65,3 | 51,7 |
| 97,6 | 87,5 | 78,5 | 72,2 | 66,6 | 52,5 |
| 99,8 | 89,3 | 80,1 | 73,6 | 67,8 | 53,3 |
| 102,0 | 91,2 | 81,7 | 75,0 | 69,0 | 54,0 |
| 104,3 | 93,0 | 83,3 | 76,4 | 70,3 | 54,8 |
| 106,5 | 94,8 | 84,8 | 77,9 | 71,5 | 55,6 |
| 108,7 | 96,6 | 86,4 | 79,3 | 72,7 | 56,3 |
| 110,9 | 98,4 | 87,9 | 80,7 | 73,9 | 57,1 |
| 113,1 | 100,2 | 89,5 | 82,0 | 75,1 | 57,9 |
| 115,3 | 102,0 | 91,0 | 83,4 | 76,3 | 58,6 |
| 117,5 | 103,8 | 92,6 | 84,8 | 77,5 | 59,4 |
| 119,7 | 105,6 | 94,1 | 86,2 | 78,7 | 60,1 |
| 121,9 | 107,4 | 95,6 | 87,6 | 79,9 | 60,8 |
| 124,1 | 109,2 | 97,1 | 88,9 | 81,1 | 61,6 |
| 126,3 | 110,9 | 98,6 | 90,3 | 82,3 | 62,3 |
| 128,5 | 112,7 | 100,2 | 91,6 | 83,5 | 63,0 |
| 130,6 | 114,4 | 101,7 | 93,0 | 84,6 | 63,7 |
| 132,8 | 116,2 | 103,2 | 94,3 | 85,8 | 64,4 |
| 135,0 | 117,9 | 104,7 | 95,7 | 87,0 | 65,1 |
| 137,1 | 119,7 | 106,1 | 97,0 | 88,1 | 65,8 |
| 139,3 | 121,4 | 107,6 | 98,4 | 89,3 | 66,5 |
| 141,4 | 123,1 | 109,1 | 99,7 | 90,4 | 67,2 |
| 143,6 | 124,9 | 110,6 | 101,0 | 94,6 | 67,9 |
| 145,7 | 126,6 | 112,1 | 102,4 | 92,7 | 68,6 |
| 147,9 | 128,3 | 113,5 | 103,7 | 93,9 | 69,3 |
| 150,0 | 130,0 | 115,0 | 105,0 | 95,0 | 70,0 |
Please do not focus on the diagram at the beginning of the post - it does not correspond to the data from the table.
Calculation of the temperature graph
The method for calculating the temperature graph is described in the handbook "Setting up and operation of water heating networks" (Chapter 4, p. 4.4, p. 153,).
This is a rather laborious and lengthy process, since several values must be read for each outdoor temperature: T1, T3, T2, etc.
To our joy, we have a computer and a MS Excel spreadsheet. A colleague at work shared with me a ready-made table for calculating the temperature graph. She was once made by his wife, who worked as an engineer for a group of regimes in thermal networks.

Table for calculating the temperature graph in MS Excel
In order for Excel to calculate and build a graph, it is enough to enter several initial values:
- design temperature in the supply pipeline of the heating network T1
- design temperature in the return pipe of the heating network T2
- design temperature in the supply pipe of the heating system T3
- Outdoor air temperature Tn.v.
- Indoor temperature Tv.p.
- coefficient "n" (it is usually not changed and is equal to 0.25)
- Minimum and maximum cut of the temperature graph Cut min, Cut max.
Entering initial data into the table for calculating the temperature graph
Everything. nothing more is required of you. The results of the calculations will be in the first table of the sheet. It is highlighted in bold.
The charts will also be rebuilt for the new values.

Graphical representation of the temperature graph
The table also considers the temperature of direct network water, taking into account wind speed.
Download temperature chart calculation
energoworld.ru
Appendix e Temperature chart (95 – 70) °С
| Design temperature outdoor | Water temperature in server pipeline | Water temperature in return pipeline | Estimated outdoor temperature | Supply water temperature | Water temperature in return pipeline |
Appendix e
CLOSED HEATING SYSTEM
TV1: G1 = 1V1; G2=G1; Q = G1(h2 –h3)
OPEN HEATING SYSTEM
WITH WATER TANK INTO A DEAD-END DHW SYSTEM
TV1: G1 = 1V1; G2 = 1V2; G3 = G1 - G2;
Q1 \u003d G1 (h2 - h3) + G3 (h3 - hx)
Bibliography
1. Gershunsky B.S. Fundamentals of electronics. Kyiv, Vishcha school, 1977.
2. Meyerson A.M. Radio-measuring equipment. - Leningrad.: Energy, 1978. - 408s.
3. Murin G.A. Thermotechnical measurements. -M.: Energy, 1979. -424 p.
4. Spector S.A. Electrical measurements physical quantities. Tutorial. - Leningrad.: Energoatomizdat, 1987. –320s.
5. Tartakovskii D.F., Yastrebov A.S. Metrology, standardization and technical means measurements. - M .: Higher school, 2001.
6. Heat meters TSK7. Manual. - St. Petersburg.: CJSC TEPLOKOM, 2002.
7. Calculator of the amount of heat VKT-7. Manual. - St. Petersburg.: CJSC TEPLOKOM, 2002.
Zuev Alexander Vladimirovich
Neighboring files in the Process Measurements and Instruments folder
studfiles.net
Heating temperature chart
The task of organizations serving houses and buildings is to maintain the standard temperature. The temperature curve of heating directly depends on the temperature outside.
There are three heating systems
 Graph of outside and inside temperature
 - Centralized heat supply of a large boiler house (CHP), located at a considerable distance from the city. In this case, the heat supply organization, taking into account the heat losses in the networks, chooses a system with a temperature curve: 150/70, 130/70 or 105/70. The first digit is the temperature of the water in the supply pipe, the second digit is the temperature of the water in the return pipe.
- Small boiler houses, which are located near residential buildings. In this case, the temperature curve 105/70, 95/70 is selected.
- Individual boiler installed on private house. The most acceptable schedule is 95/70. Although it is possible to reduce the supply temperature even more, since there will be practically no heat loss. Modern boilers operate in automatic mode and maintain a constant temperature in the supply heat pipe. The 95/70 temperature chart speaks for itself. The temperature at the entrance to the house should be 95 ° C, and at the exit - 70 ° C.
IN Soviet times when everything was state-owned, all the parameters of the temperature charts were maintained. If according to the schedule there should be a supply temperature of 100 degrees, then this will be so. Such a temperature cannot be supplied to residents, so elevator units were designed. Water from the return pipeline, cooled down, was mixed into the supply system, thereby lowering the supply temperature to the standard one. In our time of universal economy, the need for elevator nodes is no longer necessary. All heat supply organizations switched to the temperature chart of the heating system 95/70. According to this graph, the coolant temperature will be 95 °C when the outside temperature is -35 °C. As a rule, the temperature at the entrance to the house no longer requires dilution. Therefore, all elevator units must be eliminated or reconstructed. Instead of conical sections that reduce both the speed and volume of the flow, put straight pipes. Seal the supply pipe from the return pipeline with a steel plug. This is one of the heat saving measures. It is also necessary to insulate the facades of houses, windows. Change old pipes and batteries to new ones - modern ones. These measures will increase the air temperature in dwellings, which means you can save on heating temperature. Lowering the temperature on the street is immediately reflected in the residents in the receipts.
 heating temperature chart
 Most Soviet cities were built with an "open" heating system. This is when water from the boiler room comes directly to consumers in homes and is used for personal needs of citizens and heating. During the reconstruction of systems and the construction of new heating systems, a "closed" system is used. The water from the boiler house reaches the heating point in the microdistrict, where it heats the water to 95 °C, which goes to the houses. It turns out two closed rings. This system allows heat supply organizations to significantly save resources for heating water. Indeed, the volume of heated water leaving the boiler room will be almost the same at the entrance to the boiler room. No need to get into the system cold water.
Temperature charts are:
- optimal. The heat resource of the boiler room is used exclusively for heating houses. Temperature control takes place in the boiler room. The supply temperature is 95 °C.
- elevated. The heat resource of the boiler house is used for heating houses and hot water supply. A two-pipe system enters the house. One pipe is heating, the other pipe is hot water supply. Supply temperature 80 - 95 °C.
- adjusted. The heat resource of the boiler house is used for heating houses and hot water supply. One-pipe system approaches the house. From one pipe in the house, a heat resource is taken for heating and hot water for residents. Supply temperature - 95 - 105 °C.
How to carry out the temperature heating schedule. It is possible in three ways:
- quality (regulation of the temperature of the coolant).
- quantitative (regulation of the coolant volume by turning on additional pumps on the return pipeline, or installing elevators and washers).
- qualitative-quantitative (to regulate both the temperature and the volume of the coolant).
The quantitative method prevails, which is not always able to withstand the heating temperature graph.
Fight against heat supply organizations. This struggle is waged by management companies. By law, the management company is obliged to conclude an agreement with the heat supply organization. Will it be a contract for the supply of heat resources or just an agreement on interaction, the management company decides. An annex to this agreement will be a temperature schedule for heating. The heat supply organization is obliged to approve the temperature schemes in the city administration. The heat supply organization supplies the heat resource to the wall of the house, that is, to the metering stations. By the way, the legislation establishes that thermal workers are obliged to install metering stations in houses at their own expense with an installment payment of the cost for residents. So, having metering devices at the entrance and exit from the house, you can control the heating temperature daily. We take the temperature table, look at the air temperature on the weather site and find in the table the indicators that should be. If there are deviations, you need to complain. Even if deviations in big side residents will pay more. At the same time, the windows will be opened and the rooms will be ventilated. It is necessary to complain about insufficient temperature to the heat supply organization. If there is no response, we write to the city administration and Rospotrebnadzor.
Until recently, there was a multiplying coefficient on the cost of heat for residents of houses that were not equipped with common house meters. Due to the sluggishness of managing organizations and thermal workers, ordinary residents suffered.
An important indicator in the heating temperature chart is the return temperature of the network. In all graphs, this is an indicator of 70 ° C. In severe frosts, when heat losses increase, heat supply organizations are forced to turn on additional pumps on the return pipeline. This measure increases the speed of water movement through the pipes, and, therefore, the heat transfer increases, and the temperature in the network is maintained.
Again, during the period of general savings, it is very problematic to force thermal workers to turn on additional pumps, which means increasing electricity costs.
The heating temperature graph is calculated based on the following indicators:
- ambient air temperature;
- supply pipeline temperature;
- return pipeline temperature;
- the amount of heat energy consumed at home;
- required amount of thermal energy.
For different rooms, the temperature schedule is different. For children's institutions (schools, gardens, palaces of art, hospitals), the temperature in the room should be between +18 and +23 degrees according to sanitary and epidemiological standards.
- For sports facilities - 18 °C.
- For residential premises - in apartments not lower than +18 °C, in corner rooms + 20 °C.
- For non-residential premises - 16-18 ° C. Based on these parameters, heating schedules are built.
It is easier to calculate the temperature schedule for a private house, since the equipment is mounted right in the house. A zealous owner will provide heating to the garage, bathhouse, and outbuildings. The load on the boiler will increase. Counting heat load depending on the maximum low air temperatures of past periods. We select equipment by power in kW. The most cost-effective and environmentally friendly boiler is natural gas. If gas is brought to you, this is already half the battle done. You can also use bottled gas. At home, you do not have to adhere to standard temperature schedules of 105/70 or 95/70, and it does not matter that the temperature in the return pipeline is not 70 ° C. Adjust the network temperature to your liking.
By the way, many city dwellers would like to install individual heat meters and control the temperature schedule themselves. Contact the heat supply companies. And there they hear such answers. Most of the houses in the country are built on a vertical heating system. Water is supplied from the bottom - up, less often: from top to bottom. With such a system, the installation of heat meters is prohibited by law. Even if a specialized organization installs these meters for you, the heat supply organization simply will not accept these meters for operation. That is, savings will not work. Installation of meters is possible only with horizontal heating distribution.
In other words, when a pipe with heating comes into your home not from above, not from below, but from the entrance corridor - horizontally. At the place of entry and exit of heating pipes, individual heat meters can be installed. Installation of such counters pays off in two years. All houses are now being built with just such a wiring system. Heating appliances are equipped with control knobs (taps). If the temperature in the apartment is high in your opinion, then you can save money and reduce the heating supply. Only ourselves we will save from freezing.
myaquahouse.ru
Temperature chart of the heating system: variations, application, shortcomings
The temperature chart of the heating system 95 -70 degrees Celsius is the most demanded temperature chart. By and large, we can say with confidence that all central heating systems operate in this mode. The only exceptions are buildings with autonomous heating.
But even in autonomous systems there may be exceptions when using condensing boilers.
When using boilers operating on the condensation principle, the temperature curves of heating tend to be lower.

Temperature in pipelines depending on the outside air temperature
Application of condensing boilers
For example, at maximum load for a condensing boiler, there will be a mode of 35-15 degrees. This is due to the fact that the boiler extracts heat from the exhaust gases. In a word, with other parameters, for example, the same 90-70, it will not be able to work effectively.
Distinctive properties of condensing boilers are:
- high efficiency;
- profitability;
- optimal efficiency at minimum load;
- quality of materials;
- high price.
You have heard many times that the efficiency of a condensing boiler is about 108%. Indeed, the manual says the same thing.

Condensing boiler Valliant
But how can this be, because we were taught from the school desk that more than 100% does not happen.
- The thing is that when calculating the efficiency of conventional boilers, 100% is taken as the maximum. But ordinary gas boilers for heating a private house, flue gases are simply thrown into the atmosphere, and condensing ones utilize part of the outgoing heat. The latter will go to heating in the future.
- The heat that will be utilized and used in the second round is added to the efficiency of the boiler. Typically, a condensing boiler utilizes up to 15% of flue gases, this figure is adjusted to the efficiency of the boiler (approximately 93%). The result is a number of 108%.
- Undoubtedly, heat recovery is a necessary thing, but the boiler itself costs a lot of money for such work. The high price of the boiler due to stainless heat exchange equipment, which utilizes heat in the last path of the chimney.
- If instead of such stainless equipment we put ordinary iron equipment, then it will become unusable after a very short period of time. Since the moisture contained in the flue gases has aggressive properties.
- main feature condensing boilers lies in the fact that they achieve maximum efficiency with minimum loads. Ordinary boilers (gas heaters), on the contrary, reach the peak of economy at maximum load.
- The beauty of this useful property is that during the entire heating period, the load on heating is not always maximum. On the strength of 5-6 days, an ordinary boiler works at maximum. Therefore, a conventional boiler cannot match the performance of a condensing boiler, which has maximum performance at minimum loads.
You can see a photo of such a boiler a little higher, and a video with its operation can be easily found on the Internet.

Principle of operation
conventional heating system
It is safe to say that the heating temperature schedule of 95 - 70 is the most in demand.
This is explained by the fact that all houses that receive heat from central heat sources are designed to work in this mode. And we have more than 90% of such houses.

District boiler house
The principle of operation of such heat production occurs in several stages:
- heat source (district boiler house), produces water heating;
- heated water, through the main and distribution networks, moves to consumers;
- in the house of consumers, most often in the basement, through the elevator unit, hot water is mixed with water from the heating system, the so-called return flow, the temperature of which is not more than 70 degrees, and then heated to a temperature of 95 degrees;
- further heated water (the one that is 95 degrees) passes through the heaters of the heating system, heats the premises and again returns to the elevator.
Advice. If you have a cooperative house or a society of co-owners of houses, then you can set up the elevator with your own hands, but this requires you to strictly follow the instructions and correctly calculate the throttle washer.
Poor heating system
Very often we hear that people's heating does not work well and their rooms are cold.
There can be many reasons for this, the most common are:
- the temperature schedule of the heating system is not observed, the elevator may be incorrectly calculated;
- the house heating system is heavily polluted, which greatly impairs the passage of water through the risers;
- fuzzy heating radiators;
- unauthorized change of the heating system;
- poor thermal insulation of walls and windows.
A common mistake is an incorrectly dimensioned elevator nozzle. As a result, the function of mixing water and the operation of the entire elevator as a whole is disrupted.
This could happen for several reasons:
- negligence and lack of training of operating personnel;
- incorrectly performed calculations in the technical department.
During many years of operation of heating systems, people rarely think about the need to clean their heating systems. By and large, this applies to buildings that were built during the Soviet Union.
All heating systems must undergo hydropneumatic flushing before each heating season. But this is observed only on paper, since ZhEKs and other organizations carry out these works only on paper.
As a result, the walls of the risers become clogged, and the latter become smaller in diameter, which violates the hydraulics of the entire heating system as a whole. The amount of transmitted heat decreases, that is, someone simply does not have enough of it.
You can do hydropneumatic purge with your own hands, it is enough to have a compressor and a desire.
The same applies to cleaning radiators. Over many years of operation, radiators inside accumulate a lot of dirt, silt and other defects. Periodically, at least once every three years, they need to be disconnected and washed.
Dirty radiators greatly impair the heat output in your room.
The most common moment is an unauthorized change and redevelopment of heating systems. When replacing old metal pipes with metal-plastic ones, diameters are not observed. And sometimes various bends are added, which increases local resistance and worsens the quality of heating.

Metal-plastic pipe
Very often, with such unauthorized reconstruction and replacement of heating batteries with gas welding, the number of radiator sections also changes. And really, why not give yourself more sections? But in the end, your housemate, who lives after you, will receive less of the heat he needs for heating. And the last neighbor, who will receive less heat the most, will suffer the most.
An important role is played by the thermal resistance of building envelopes, windows and doors. As statistics show, up to 60% of heat can escape through them.
Elevator node
As we said above, all water-jet elevators are designed to mix water from the supply line of heating networks into the return line of the heating system. Thanks to this process, system circulation and pressure are created.
As for the material used for their manufacture, both cast iron and steel are used.
Consider the principle of operation of the elevator in the photo below.

The principle of operation of the elevator
Through branch pipe 1, water from heating networks passes through the ejector nozzle and enters the mixing chamber 3 at high speed. There, water from the return of the building's heating system is mixed with it, the latter is supplied through branch pipe 5.
The resulting water is sent to the heating system supply through diffuser 4.
In order for the elevator to function correctly, it is necessary that its neck be correctly selected. To do this, calculations are made using the formula below:
Where ΔРnas - design circulation pressure in the heating system, Pa;
Gcm - water consumption in heating system kg/h
For your information! True, for such a calculation, you need a building heating scheme.
The appearance of the elevator unit
Have a warm winter!
Page 2
In the article, we will find out how the average daily temperature is calculated when designing heating systems, how the temperature of the coolant at the outlet of the elevator unit depends on the temperature outside, and what the temperature of the heating batteries can be in winter.
We will also touch on the topic of self-combating the cold in the apartment.

Cold in winter is a sore subject for many residents of city apartments.
general information
Here we present the main provisions and excerpts from the current SNiP.
Outside temperature
The design temperature of the heating period, which is included in the design of heating systems, is nothing less than the average temperature of the coldest five-day periods for the eight coldest winters of the last 50 years.
This approach allows, on the one hand, to be prepared for severe frosts which happen only once every few years, on the other hand, do not invest excessive funds in the project. On the scale of mass development we are talking about very significant amounts.
Target room temperature
It should be noted right away that the temperature in the room is affected not only by the temperature of the coolant in the heating system.
Several factors are at work in parallel:
- Air temperature outside. The lower it is, the greater the heat leakage through walls, windows and roofs.
- Presence or absence of wind. A strong wind increases the heat loss of buildings, blowing porches, basements and apartments through unsealed doors and windows.
- The degree of insulation of the facade, windows and doors in the room. It is clear that in the case of a hermetically sealed plastic window with a double-glazed window, heat loss will be much lower than with a cracked wooden window and double-glazed windows.
It is curious: now there has been a trend towards the construction of apartment buildings with the maximum degree of thermal insulation. In the Crimea, where the author lives, new houses are being built right away with the facade insulated with mineral wool or foam plastic and with hermetically closing doors of entrances and apartments.

The facade is covered from the outside with basalt fiber slabs.
- And finally, the actual temperature of the heating radiators in the apartment.
So, what are the current temperature standards in rooms for various purposes?
- In the apartment: corner rooms - not lower than 20C, other living rooms - not lower than 18C, bathroom - not lower than 25C. Nuance: when the design air temperature is below -31C for corner and other living rooms, higher values are taken, +22 and +20C (source - Decree of the Government of the Russian Federation of 05/23/2006 "Rules for providing utilities citizens").
- In kindergarten: 18-23 degrees depending on the purpose of the room for toilets, bedrooms and game rooms; 12 degrees for walking verandas; 30 degrees for indoor swimming pools.
- In educational institutions: from 16C for boarding school bedrooms to +21 in classrooms.
- In theaters, clubs, other places of entertainment: 16-20 degrees for the auditorium and + 22C for the stage.
- For libraries (reading rooms and book depositories) the norm is 18 degrees.
- In grocery stores, the normal winter temperature is 12, and in non-food stores - 15 degrees.
- The temperature in the gyms is maintained at 15-18 degrees.

For obvious reasons, the heat in the gym is useless.
- In hospitals, the maintained temperature depends on the purpose of the room. For example, the recommended temperature after otoplasty or childbirth is +22 degrees, in the wards for premature babies it is maintained at +25, and for patients with thyrotoxicosis (excessive secretion of thyroid hormones) - 15C. In surgical wards, the norm is + 26C.
temperature graph
What should be the temperature of the water in the heating pipes?
It is determined by four factors:
- Air temperature outside.
- Type of heating system. For a single-pipe system, the maximum water temperature in the heating system in accordance with current standards is 105 degrees, for a two-pipe system - 95. The maximum temperature difference between supply and return is 105/70 and 95/70C, respectively.
- The direction of the water supply to the radiators. For houses of the upper bottling (with supply in the attic) and lower (with pairwise looping of the risers and the location of both threads in the basement), the temperatures differ by 2 - 3 degrees.
- Type of heating appliances in the house. Radiators and gas heating convectors have different heat transfer; accordingly, to ensure the same room temperature temperature regime heating must be different.

The convector somewhat loses to the radiator in terms of thermal efficiency.
So, what should be the temperature of heating - water in the supply and return pipes - at different outdoor temperatures?
We give only a small part of the temperature table for the estimated ambient temperature of -40 degrees.
- At zero degrees, the temperature of the supply pipeline for radiators with different wiring is 40-45C, the return one is 35-38. For convectors 41-49 supply and 36-40 return.
- At -20 for radiators, the supply and return must have a temperature of 67-77 / 53-55C. For convectors 68-79/55-57.
- At -40C outside, for all heaters, the temperature reaches the maximum allowable temperature: 95/105, depending on the type of heating system, at the supply and 70C at the return pipe.
Useful extras
To understand the principle of operation of the heating system apartment building, separation of areas of responsibility, you need to know a few more facts.
The temperature of the heating main at the outlet from the CHP and the temperature of the heating system in your home are completely different things. At the same -40, a CHP or boiler house will produce about 140 degrees at the supply. Water does not evaporate only due to pressure.
In the elevator unit of your house, part of the water from the return pipeline, returning from the heating system, is mixed into the supply. The nozzle injects a jet of hot water at high pressure into the so-called elevator and recirculates the masses of cooled water.
Schematic diagram of the elevator.
Why is this needed?
To provide:
- Reasonable mixture temperature. Recall: the heating temperature in the apartment cannot exceed 95-105 degrees.
Attention: for kindergartens, a different temperature norm applies: no higher than 37C. The low temperature of the heating devices has to be compensated by a large heat exchange area. That is why in kindergartens the walls are decorated with radiators of such great length.
- Large volume of water involved in circulation. If you remove the nozzle and let the water flow directly from the supply, the return temperature will not differ much from the supply, which will dramatically increase heat loss on the route and disrupt the operation of the CHP.
If you stop the suction of water from the return, the circulation will become so slow that the return pipeline can simply freeze in winter.
The areas of responsibility are divided as follows:
- The temperature of the water injected into the heating mains is the responsibility of the heat producer - the local CHP or boiler house;
- For the transportation of the coolant with minimal losses - the organization serving the heating networks (KTS - communal heating networks).

Such a state of heating mains, as in the photo, means huge heat losses. This is the area of responsibility of the KTS.
- For maintenance and adjustment of the elevator unit - housing department. In this case, however, the diameter of the elevator nozzle - something on which the temperature of the radiators depends - is coordinated with the CTC.
If your house is cold and all the heating devices are those installed by the builders, you will settle this issue with the residents. They are required to provide the temperatures recommended by sanitary standards.
If you undertake any modification of the heating system, for example, replacing the heating batteries with gas welding, you thereby assume full responsibility for the temperature in your home.
How to deal with the cold
Let us, however, be realistic: most often we have to solve the problem of cold in the apartment ourselves, with our own hands. Not always a housing organization can provide you with heat in a reasonable time, and sanitary norms not everyone will be satisfied: I want the house to be warm.
What will the instructions for dealing with cold in an apartment building look like?
Jumpers in front of radiators
There are jumpers in front of the heaters in most apartments, which are designed to ensure the circulation of water in the riser in any condition of the radiator. For a long time they were supplied three-way valves, then they began to be installed without any shut-off valves.
The jumper in any case reduces the circulation of the coolant through the heater. In the case when its diameter is equal to the diameter of the eyeliner, the effect is especially pronounced.
The simplest way to make your apartment warmer is to insert chokes into the jumper itself and the connection between it and the radiator.

Here, ball valves perform the same function. It's not entirely correct, but it will work.
With their help, it is possible to conveniently adjust the temperature of the heating batteries: when the jumper is closed and the throttle to the radiator is fully open, the temperature is maximum, it is worth opening the jumper and covering the second throttle - and the heat in the room comes to naught.
The great advantage of such a refinement is the minimum cost of the solution. The price of the throttle does not exceed 250 rubles; spurs, couplings and locknuts cost a penny at all.
Important: if the throttle leading to the radiator is at least slightly covered, the throttle on the jumper opens completely. Otherwise, adjusting the heating temperature will result in batteries and convectors that have cooled down at the neighbors.

Another helpful change. With such a tie-in, the radiator will always be evenly hot along the entire length.
Warm floor
Even if the radiator in the room hangs on a return riser with a temperature of about 40 degrees, by modifying the heating system, you can make the room warm.
An output - low-temperature systems of heating.
In a city apartment, it is difficult to use underfloor heating convectors due to the limited height of the room: raising the floor level by 15-20 centimeters will mean completely low ceilings.
Much more real option- warm floor. Due to where larger area heat transfer and more rational distribution heat in the volume of the room low-temperature heating will warm the room better than a red-hot radiator.
What does the implementation look like?
- Chokes are placed on the jumper and the eyeliner in the same way as in the previous case.
- The outlet from the riser to the heater is connected to metal-plastic pipe, which fits into the screed on the floor.
So that communications do not spoil appearance rooms, they are put away in a box. As an option, the tie-in to the riser is moved closer to the floor level.

It is not a problem at all to transfer the valves and throttles to any convenient place.
Conclusion
You can find more information about the operation of centralized heating systems in the video at the end of the article. Warm winters!
Page 3
The building heating system is the heart of all engineering and technical mechanisms of the whole house. Which of its components will be selected will depend on:
- Efficiency;
- Profitability;
- Quality.

Selection of sections for the room
All of the above qualities directly depend on:
- heating boiler;
- pipelines;
- Method of connecting the heating system to the boiler;
- heating radiators;
- coolant;
- Adjustment mechanisms (sensors, valves and other components).
One of the main points is the selection and calculation of sections of heating radiators. In most cases, the number of sections is calculated by design organizations that develop a complete project for building a house.
This calculation is affected by:
- Enclosing materials;
- The presence of windows, doors, balconies;
- Room dimensions;
- Type of premises (living room, warehouse, corridor);
- Location;
- Orientation to the cardinal points;
- Location in the building of the calculated room (corner or in the middle, on the first floor or last).
The data for the calculation are taken from the SNiP "Construction Climatology". The calculation of the number of sections of heating radiators according to SNiP is very accurate, thanks to which you can perfectly calculate the heating system.
Ph.D. Petrushchenkov V.A., Research Laboratory “Industrial Heat Power Engineering”, Peter the Great St. Petersburg State Polytechnic University, St. Petersburg
1. The problem of reducing the design temperature schedule for regulating heat supply systems nationwide
Over the past decades, in almost all cities of the Russian Federation, there has been a very significant gap between the actual and projected temperature curves for regulating heat supply systems. As you know, closed and open systems district heating in the cities of the USSR they were designed using high-quality regulation with a temperature schedule for regulating the seasonal load of 150-70 ° С. Such a temperature schedule was widely used both for thermal power plants and for district boiler houses. But, starting from the end of the 1970s, significant deviations of network water temperatures appeared in the actual control curves from their design values at low outdoor air temperatures. Under the design conditions for the outside air temperature, the water temperature in the supply heat pipelines decreased from 150 °С to 85…115 °С. The lowering of the temperature schedule by the owners of heat sources was usually formalized as work on a project schedule of 150-70°С with a “cutoff” at a low temperature of 110…130°С. At lower coolant temperatures, the heat supply system was supposed to operate according to the dispatch schedule. Calculation justifications for such a transition are not known to the author of the article.
The transition to a lower temperature schedule, for example, 110-70 °С from the design schedule of 150-70 °С, should entail a number of serious consequences, which are dictated by the balance energy ratios. In connection with a decrease in the estimated temperature difference of network water by 2 times, while maintaining the heat load of heating, ventilation, it is necessary to ensure an increase in the consumption of network water for these consumers also by 2 times. The corresponding pressure losses in the network water in the heating network and in the heat exchange equipment of the heat source and heat points with a quadratic law of resistance will increase by 4 times. The required increase in the power of network pumps should occur 8 times. It is obvious that neither throughput of heat networks designed for a schedule of 150-70 °С, nor the installed network pumps will ensure the delivery of the coolant to consumers with a double flow rate compared to the design value.
In this regard, it is quite clear that in order to ensure a temperature schedule of 110-70 ° C, not on paper, but in reality, a radical reconstruction of both heat sources and the heat network with heat points will be required, the costs of which are unbearable for the owners of heat supply systems.
The ban on the use for heat networks of heat supply control schedules with “cutoff” by temperature, given in clause 7.11 of SNiP 41-02-2003 “Heat Networks”, could not affect the widespread practice of its application. In the updated version of this document, SP 124.13330.2012, the mode with “cutoff” in temperature is not mentioned at all, that is, there is no direct ban on this method of regulation. This means that such methods of seasonal load regulation should be chosen, in which the main task will be solved - ensuring normalized temperatures in the premises and normalized water temperature for the needs of hot water supply.
Into the approved List of national standards and codes of practice (parts of such standards and codes of practice), as a result of which, on a mandatory basis, compliance with the requirements is ensured federal law dated December 30, 2009 No. 384-FZ " Technical regulation on the Safety of Buildings and Structures" (Decree of the Government of the Russian Federation dated December 26, 2014 No. 1521) included the revisions of SNiP after updating. This means that the use of "cutting off" temperatures today is a completely legal measure, both from the point of view of the List of National Standards and Codes of Rules, and and from the point of view of the updated edition of the profile SNiP “Heat Networks”.
Federal Law No. 190-FZ dated July 27, 2010 “On heat supply”, “Rules and norms for the technical operation of the housing stock” (approved by Decree of the Gosstroy of the Russian Federation dated September 27, 2003 No. 170), SO 153-34.20.501-2003 “Rules for the technical exploitation power stations and networks of the Russian Federation” also do not prohibit the regulation of seasonal heat load with a “cutoff” in temperature.
In the 90s, good reasons that explained the radical decrease in the design temperature schedule were considered to be the deterioration of heating networks, fittings, compensators, as well as the inability to provide the necessary parameters at heat sources due to the state of heat exchange equipment. Despite the large amount of repair work carried out constantly in heating networks and heat sources in recent decades, this reason remains relevant today for a significant part of almost any heat supply system.
It should be noted that in the technical specifications for connection to heat networks of most heat sources, a design temperature schedule of 150-70 ° C, or close to it, is still given. When coordinating the projects of central and individual heating points, an indispensable requirement of the owner of the heating network is to limit the flow of network water from the supply heat pipeline of the heating network during the entire heating period in strict accordance with the design, and not the actual temperature control schedule.
Currently, the country is massively developing heat supply schemes for cities and settlements, in which also design schedules for regulating 150-70 ° С, 130-70 ° С are considered not only relevant, but also valid for 15 years ahead. At the same time, there are no explanations on how to ensure such graphs in practice, there is no clear justification for the possibility of providing the connected heat load at low outdoor temperatures under conditions of real regulation of seasonal heat load.
Such a gap between the declared and actual temperatures of the heat carrier of the heating network is abnormal and has nothing to do with the theory of operation of heat supply systems, given, for example, in.
Under these conditions, it is extremely important to analyze the actual situation with the hydraulic mode of operation of heating networks and with the microclimate of heated rooms at the calculated outdoor air temperature. The actual situation is such that, despite a significant decrease in the temperature schedule, while ensuring the design flow of network water in the heating systems of cities, as a rule, there is no significant decrease in the design temperatures in the premises, which would lead to resonant accusations of the owners of heat sources in failure to fulfill their main task: ensuring standard temperatures in the premises. In this regard, the following natural questions arise:
1. What explains such a set of facts?
2. Is it possible not only to explain the current state of affairs, but also to substantiate, based on the provision of the requirements of modern regulatory documentation, either the “cutting off” of the temperature graph at 115 ° C, or a new temperature graph of 115-70 (60) ° C with a qualitative regulation of the seasonal load?
This problem, of course, constantly attracts everyone's attention. Therefore, publications appear in the periodical press, which provide answers to the questions posed and provide recommendations for eliminating the gap between the design and actual parameters of the heat load control system. In some cities, measures have already been taken to reduce the temperature schedule and an attempt is being made to generalize the results of such a transition.
From our point of view, this problem is discussed most prominently and clearly in the article by Gershkovich V.F. .
It notes several extremely important provisions, which are, among other things, a generalization of practical actions to normalize the operation of heat supply systems under conditions of low-temperature “cutoff”. It is noted that practical attempts to increase the consumption in the network in order to bring it into line with the reduced temperature schedule have not been successful. Rather, they contributed to the hydraulic misalignment of the heating network, as a result of which the costs of network water between consumers were redistributed disproportionately to their heat loads.
At the same time, while maintaining the design flow in the network and reducing the temperature of the water in the supply line, even at low outdoor temperatures, in some cases, it was possible to ensure the air temperature in the premises at an acceptable level. The author explains this fact by the fact that in the heating load a very significant part of the power falls on the heating of fresh air, which ensures the normative air exchange of the premises. Real air exchange on cold days is far from the normative value, since it cannot be provided only by opening the vents and sashes of window blocks or double-glazed windows. The article emphasizes that Russian air exchange standards are several times higher than those of Germany, Finland, Sweden, and the USA. It is noted that in Kyiv, the decrease in the temperature schedule due to the “cutting off” from 150 ° C to 115 ° C was implemented and had no negative consequences. Similar work was done in the heating networks of Kazan and Minsk.
This article discusses the current state of the Russian requirements for regulatory documentation for indoor air exchange. Using the example of model problems with averaged parameters of the heat supply system, the influence of various factors on its behavior at a water temperature in the supply line of 115 °C under design conditions for the outdoor temperature was determined, including:
Reducing the air temperature in the premises while maintaining the design water flow in the network;
Increasing the flow of water in the network in order to maintain the temperature of the air in the premises;
Reducing the power of the heating system by reducing the air exchange for the design water flow in the network while ensuring the calculated air temperature in the premises;
Estimation of the capacity of the heating system by reducing the air exchange for the actually achievable increased water consumption in the network while ensuring the calculated air temperature in the premises.
2. Initial data for analysis
As initial data, it is assumed that there is a source of heat supply with a dominant load of heating and ventilation, a two-pipe heating network, a central heating station and an ITP, heating devices, heaters, water taps. The type of heating system is not of fundamental importance. It is assumed that the design parameters of all links of the heat supply system ensure the normal operation of the heat supply system, that is, in the premises of all consumers, the design temperature is set to t w.r = 18 ° C, subject to the temperature schedule of the heating network of 150-70 ° C, the design value of the flow of network water , standard air exchange and quality regulation of seasonal load. The calculated outdoor air temperature is equal to the average temperature of the cold five-day period with a security factor of 0.92 at the time of the creation of the heat supply system. The mixing ratio of elevator units is determined by the generally accepted temperature curve for regulating heating systems 95-70 ° C and is equal to 2.2.
It should be noted that in the updated version of SNiP “Construction Climatology” SP 131.13330.2012 for many cities there was an increase in the design temperature of the cold five-day period by several degrees compared to the version of the document SNiP 23-01-99.
3. Calculations of operating modes of the heat supply system at a temperature of direct network water of 115 °C
The work in the new conditions of the heat supply system, created over decades according to modern standards for the construction period, is considered. The design temperature schedule for the qualitative regulation of the seasonal load is 150-70 °C. It is believed that at the time of commissioning, the heat supply system performed its functions exactly.
As a result of the analysis of the system of equations describing the processes in all parts of the heat supply system, its behavior is determined at a maximum water temperature in the supply line of 115 ° C at a design outdoor temperature, mixing ratios of elevator units of 2.2.
One of the defining parameters of the analytical study is the consumption of network water for heating and ventilation. Its value is taken in the following options:
The design value of the flow rate in accordance with the schedule 150-70 ° C and the declared load of heating, ventilation;
The value of the flow rate, providing the design air temperature in the premises under the design conditions for the outside air temperature;
Actual maximum possible meaning consumption of network water, taking into account the installed network pumps.
3.1. Reducing the air temperature in the rooms while maintaining the connected heat loads
Let us determine how the average temperature in the premises will change at the temperature of the network water in the supply line to 1 = 115 ° С, the design consumption of the network water for heating (we will assume that the entire load is heating, since the ventilation load is of the same type), based on the design schedule 150-70 °С, at outdoor air temperature t n.o = -25 °С. We consider that at all elevator nodes the mixing coefficients u are calculated and are equal to
![]()
For the design design conditions of operation of the heat supply system ( , , , ), the following system of equations is valid:
where - the average value of the heat transfer coefficient of all heating devices with a total heat exchange area F, - the average temperature difference between the coolant of the heating devices and the air temperature in the premises, G o - the estimated flow rate of network water entering the elevator units, G p - the estimated flow rate of water entering into heating devices, G p \u003d (1 + u) G o , s - specific mass isobaric heat capacity of water, - the average design value of the heat transfer coefficient of the building, taking into account the transport of thermal energy through external fences with a total area A and the cost of thermal energy for heating the standard flow rate of the outdoor air.
At a low temperature of the network water in the supply line t o 1 =115 ° C, while maintaining the design air exchange, the average air temperature in the premises decreases to the value t in. The corresponding system of equations for design conditions for outdoor air will have the form
 , (3)
, (3)
where n is the exponent in the criterion dependence of the heat transfer coefficient of heating devices on the average temperature difference, see, table. 9.2, p.44. For the most common heating devices in the form of cast-iron sectional radiators and steel panel convectors of the RSV and RSG types, when the coolant moves from top to bottom, n=0.3.
Let us introduce the notation ![]() , ,
, , ![]() .
.
From (1)-(3) follows the system of equations
![]() ,
,
![]() ,
,
whose solutions look like:
![]() , (4)
, (4)
 (5)
(5)
![]() . (6)
. (6)
For the given design values of the parameters of the heat supply system
![]() ,
,
![]()
Equation (5), taking into account (3) for a given temperature of direct water under the design conditions, allows us to obtain a ratio for determining the air temperature in the premises:
The solution to this equation is t in =8.7°C.
The relative thermal power of the heating system is equal to

Therefore, when the temperature of the direct network water changes from 150 °C to 115 °C, the average air temperature in the premises decreases from 18 °C to 8.7 °C, the heat output of the heating system drops by 21.6%.
The calculated values of water temperatures in the heating system for the accepted deviation from the temperature schedule are °С, °С.
The performed calculation corresponds to the case when the outdoor air flow during the operation of the ventilation and infiltration system corresponds to the design standard values up to the outdoor air temperature t n.o = -25°C. Since in residential buildings, as a rule, natural ventilation is used, organized by residents when ventilating with the help of vents, window sashes and micro-ventilation systems for double-glazed windows, it can be argued that at low outdoor temperatures, the flow of cold air entering the premises, especially after almost complete replacement of window blocks with double-glazed windows is far from the normative value. Therefore, the air temperature in residential premises is in fact much higher than a certain value of t in = 8.7 ° C.
3.2 Determining the power of the heating system by reducing the ventilation of indoor air at the estimated flow of network water
Let us determine how much it is necessary to reduce the cost of thermal energy for ventilation in the considered non-project mode of low temperature of the network water of the heating network in order for the average air temperature in the premises to remain at the standard level, that is, t in = t w.r = 18 ° C.
The system of equations describing the process of operation of the heat supply system under these conditions will take the form
The joint solution (2') with systems (1) and (3) similarly to the previous case gives the following relations for the temperatures of different water flows:
 ,
,
![]() ,
,
![]() .
.
The equation for the given temperature of direct water under the design conditions for the outdoor temperature allows you to find the reduced relative load of the heating system (only the power of the ventilation system was reduced, the heat transfer through the external fences was exactly preserved):
The solution to this equation is =0.706.
Therefore, when the temperature of the direct network water changes from 150°C to 115°C, maintaining the air temperature in the premises at the level of 18°C is possible by reducing the total heat output of the heating system to 0.706 of the design value by reducing the cost of heating the outside air. The heat output of the heating system drops by 29.4%.
The calculated values of water temperatures for the accepted deviation from the temperature schedule are °С, °С.
3.4 Increasing the consumption of network water in order to ensure the standard air temperature in the premises
Let us determine how the consumption of network water in the heating network for heating needs should increase when the temperature of the network water in the supply line drops to 1 = 115 ° С under the design conditions for the outdoor temperature t n.o = -25 ° С, so that the average temperature in the air in the premises remained at the normative level, that is, t in \u003d t w.r \u003d 18 ° C. The ventilation of the premises corresponds to the design value.
The system of equations describing the process of operation of the heat supply system, in this case, will take the form, taking into account the increase in the value of the flow rate of network water to G o y and the flow rate of water through the heating system G pu =G oh (1 + u) with a constant value of the mixing coefficient of the elevator nodes u= 2.2. For clarity, we reproduce in this system the equations (1)
 .
.
From (1), (2”), (3’) follows a system of equations of an intermediate form
![]()
The solution of the given system has the form:
° С, t o 2 \u003d 76.5 ° С,
So, when the temperature of the direct network water changes from 150 °C to 115 °C, maintaining the average air temperature in the premises at the level of 18 °C is possible by increasing the consumption of network water in the supply (return) line of the heating network for the needs of heating and ventilation systems in 2 .08 times.
Obviously, there is no such reserve in terms of network water consumption either at heat sources or at pumping stations, if any. In addition, such a high increase in network water consumption will lead to an increase in pressure losses due to friction in the pipelines of the heating network and in the equipment of heating points and the heat source by more than 4 times, which cannot be realized due to the lack of supply of network pumps in terms of pressure and engine power. . Consequently, an increase in network water consumption by 2.08 times due to an increase in the number of installed network pumps alone, while maintaining their pressure, will inevitably lead to unsatisfactory operation of elevator units and heat exchangers in most of the heating points of the heat supply system.
3.5 Reducing the power of the heating system by reducing the ventilation of indoor air in conditions of increased consumption of network water
For some heat sources, the consumption of network water in the mains can be provided above the design value by tens of percent. This is due both to the decrease in thermal loads that has taken place in recent decades, and to the presence of a certain performance reserve of installed network pumps. Let's take the maximum relative value of network water consumption equal to  =1.35 of the design value. We also take into account the possible increase in the calculated outdoor air temperature according to SP 131.13330.2012.
Let us determine how much it is necessary to reduce the average outdoor air consumption for ventilation of premises in the mode of reduced temperature of the network water of the heating network so that the average air temperature in the premises remains at the standard level, that is, tw = 18 °C.
For a low temperature of network water in the supply line t o 1 = 115 ° C, the air flow in the premises is reduced in order to maintain the calculated value of t at = 18 ° C in conditions of an increase in the flow of network water by 1.35 times and an increase in the calculated temperature of the cold five-day period. The corresponding system of equations for the new conditions will have the form
The relative decrease in the heat output of the heating system is equal to
 . (3’’)
From (1), (2'''), (3'') follows the solution
 ,
,
 ,
,
![]() .
.
For the given values of the parameters of the heat supply system and = 1.35:
; =115 °С; =66 °С; \u003d 81.3 ° С.
We also take into account the increase in the temperature of the cold five-day period to the value t n.o_ = -22 °C. The relative thermal power of the heating system is equal to
The relative change in the total heat transfer coefficients is equal to and due to a decrease in the air flow rate of the ventilation system.
For houses built before 2000, the share of heat energy consumption for ventilation of premises in the central regions of the Russian Federation is 40 ... .
For houses built after 2000, the share of ventilation costs increases to 50 ... 55%, a drop in the air flow rate of the ventilation system by approximately 1.3 times will maintain the calculated air temperature in the premises.
Above in 3.2 it is shown that with the design values of network water flow rates, indoor air temperature and design outdoor air temperature, a decrease in the network water temperature to 115 ° C corresponds to a relative power of the heating system of 0.709. If this decrease in power is attributed to a decrease in ventilation air heating, then for houses built before 2000, the air flow rate of the ventilation system of the premises should drop by approximately 3.2 times, for houses built after 2000 - by 2.3 times.
An analysis of measurement data from heat energy metering units of individual residential buildings shows that a decrease in heat energy consumption on cold days corresponds to a decrease in standard air exchange by a factor of 2.5 or more.
4. The need to clarify the calculated heating load of heat supply systems
Let the declared load of the heating system created in recent decades be . This load corresponds to the design temperature of the outside air, relevant during the construction period, taken for definiteness t n.o = -25 ° С.
The following is an estimate of the actual reduction in the declared design heating load due to the influence of various factors.
Increasing the calculated outdoor temperature to -22 °C reduces the calculated heating load to (18+22)/(18+25)x100%=93%.
In addition, the following factors lead to a reduction in the calculated heating load.
1. Replacement of window blocks with double-glazed windows, which took place almost everywhere. The share of transmission losses of thermal energy through windows is about 20% of the total heating load. Replacing window blocks with double-glazed windows led to an increase in thermal resistance from 0.3 to 0.4 m 2 ∙K / W, respectively, the thermal power of heat loss decreased to the value: x100% \u003d 93.3%.
2. For residential buildings, the share of ventilation load in the heating load in projects completed before the early 2000s is about 40...45%, later - about 50...55%. Let's take the average share of the ventilation component in the heating load in the amount of 45% of the declared heating load. It corresponds to an air exchange rate of 1.0. According to modern STO standards, the maximum air exchange rate is at the level of 0.5, the average daily air exchange rate for a residential building is at the level of 0.35. Therefore, a decrease in the air exchange rate from 1.0 to 0.35 leads to a drop in the heating load of a residential building to the value:
x100%=70.75%.
3. The ventilation load by different consumers is demanded randomly, therefore, like the DHW load for a heat source, its value is summed not additively, but taking into account the coefficients of hourly unevenness. The share of the maximum ventilation load in the declared heating load is 0.45x0.5 / 1.0 = 0.225 (22.5%). The coefficient of hourly non-uniformity is estimated to be the same as for hot water supply, equal to K hour.vent = 2.4. Therefore, the total load of heating systems for the heat source, taking into account the reduction in the ventilation maximum load, the replacement of window blocks with double-glazed windows and the non-simultaneous demand for the ventilation load, will be 0.933x(0.55+0.225/2.4)x100%=60.1% of the declared load .
4. Taking into account the increase in the design outdoor temperature will lead to an even greater drop in the design heating load.
5. The performed estimates show that the clarification of the heat load of heating systems can lead to its reduction by 30 ... 40%. Such a decrease in the heating load allows us to expect that, while maintaining the design flow of network water, the calculated air temperature in the premises can be ensured by implementing a “cutoff” of the direct water temperature at 115 °C for low outdoor air temperatures (see results 3.2). With even greater reason, this can be asserted if there is a reserve in the value of the flow of network water at the heat source of the heat supply system (see results 3.4).
The above estimates are illustrative, but it follows from them that, based on modern requirements of regulatory documentation, one can expect both a significant reduction in the total design heating load of existing consumers for a heat source, and a technically justified operating mode with a “cut” in the temperature schedule for regulating seasonal load at 115°C. The required degree of real reduction in the declared load of heating systems should be determined during field tests for consumers of a particular heat main. The calculated temperature of the return network water is also subject to clarification during field tests.
It should be borne in mind that the qualitative regulation of the seasonal load is not sustainable in terms of the distribution of thermal power among heating devices for vertical single-pipe heating systems. Therefore, in all the calculations given above, while ensuring the average design air temperature in the rooms, there will be some change in the air temperature in the rooms along the riser during the heating period at different outdoor air temperatures.
5. Difficulties in the implementation of the normative air exchange of premises
Consider the cost structure of the thermal power of the heating system of a residential building. The main components of heat losses compensated by the flow of heat from heating devices are transmission losses through external fences, as well as the cost of heating the outside air entering the premises. Fresh air consumption for residential buildings is determined by the requirements of sanitary and hygienic standards, which are given in section 6.
In residential buildings, the ventilation system is usually natural. The air flow rate is provided by the periodic opening of the vents and window sashes. At the same time, it should be borne in mind that since 2000, the requirements for the heat-shielding properties of external fences, primarily walls, have increased significantly (2 ... 3 times).
From the practice of developing energy passports for residential buildings, it follows that for buildings built from the 50s to the 80s of the last century in the central and northwestern regions, the share of thermal energy for standard ventilation (infiltration) was 40 ... 45%, for buildings built later, 45…55%.
Before the advent of double-glazed windows, the regulation of air exchange was carried out by vents and transoms, and, on cold days, the frequency of their opening decreased. With the widespread use of double-glazed windows, ensuring standard air exchange has become an even greater problem. This is due to a tenfold decrease in uncontrolled infiltration through cracks and the fact that frequent ventilation by opening window sashes, which alone can provide standard air exchange, does not actually occur.
There are publications on this topic, see, for example,. Even during periodic ventilation, there are no quantitative indicators indicating the air exchange of the premises and its comparison with the standard value. As a result, in fact, the air exchange is far from the norm and a number of problems arise: relative humidity increases, condensation forms on the glazing, mold appears, persistent odors appear, the carbon dioxide content in the air rises, which together led to the emergence of the term “sick building syndrome”. In some cases, due to a sharp decrease in air exchange, a rarefaction occurs in the premises, leading to an overturning of the air movement in the exhaust ducts and to the entry of cold air into the premises, the flow of dirty air from one apartment to another, and freezing of the walls of the channels. As a result, builders are faced with the problem of using more advanced ventilation systems that can save heating costs. In this regard, it is necessary to use ventilation systems with controlled air supply and removal, heating systems with automatic control of heat supply to heating devices (ideally, systems with apartment connection), sealed windows and entrance doors to apartments.
Confirmation that the ventilation system of residential buildings operates with a performance that is significantly less than the design one is the lower, in comparison with the calculated, heat energy consumption during the heating period, recorded by the heat energy metering units of buildings.
The calculation of the ventilation system of a residential building performed by the staff of the St. Petersburg State Polytechnical University showed the following. Natural ventilation in the mode of free air flow on average for the year is almost 50% less than the calculated one (the cross section of the exhaust duct is designed according to the current ventilation standards for multi-apartment residential buildings for the conditions of St. Petersburg for standard air exchange for outdoor temperature+5 °C), in 13% of the time ventilation is more than 2 times less than the calculated one, and in 2% of the time there is no ventilation. For a significant part of the heating period, at an outside air temperature of less than +5 °C, ventilation exceeds the standard value. That is, without special adjustment at low outdoor temperatures, it is impossible to ensure standard air exchange; at outdoor temperatures of more than +5 ° C, air exchange will be lower than standard if the fan is not used.
6. Evolution of regulatory requirements for indoor air exchange
The costs of heating the outside air are determined by the requirements given in the regulatory documentation, which have undergone a number of changes over the long period of building construction.
Consider these changes on the example of residential apartment buildings.
In SNiP II-L.1-62, part II, section L, chapter 1, in force until April 1971, the air exchange rates for living rooms were 3 m 3 / h per 1 m 2 of room area, for a kitchen with electric stoves, the air exchange rate 3, but not less than 60 m 3 / h, for a kitchen with a gas stove - 60 m 3 / h for two-burner stoves, 75 m 3 / h - for three-burner stoves, 90 m 3 / h - for four-burner stoves. Estimated temperature of living rooms +18 °С, kitchens +15 °С.
In SNiP II-L.1-71, Part II, Section L, Chapter 1, in force until July 1986, similar standards are indicated, but for a kitchen with electric stoves, the air exchange rate of 3 is excluded.
In SNiP 2.08.01-85, which were in force until January 1990, the air exchange rates for living rooms were 3 m 3 / h per 1 m 2 of room area, for the kitchen without indicating the type of plates 60 m 3 / h. Despite the different standard temperature in living quarters and in the kitchen, for heat engineering calculations, it is proposed to take the temperature of the internal air to +18°C.
In SNiP 2.08.01-89, which were in force until October 2003, the air exchange rates are the same as in SNiP II-L.1-71, Part II, Section L, Chapter 1. The indication of the internal air temperature +18 ° FROM.
In the SNiP 31-01-2003 that are still in force, new requirements appear, given in 9.2-9.4:
9.2 The design parameters of the air in the premises of a residential building should be taken according to the optimal standards of GOST 30494. The air exchange rate in the premises should be taken in accordance with Table 9.1.
Table 9.1
| room | Multiplicity or magnitude air exchange, m 3 per hour, not less |
|
| in non-working | in mode service |
|
| Bedroom, shared, children's room | 0,2 | 1,0 |
| Library, office | 0,2 | 0,5 |
| Pantry, linen, dressing room | 0,2 | 0,2 |
| Gym, billiard room | 0,2 | 80 m 3 |
| Laundry, ironing, drying | 0,5 | 90 m 3 |
| Kitchen with electric stove | 0,5 | 60 m 3 |
| Room with gas-using equipment | 1,0 | 1.0 + 100 m 3 |
| Room with heat generators and solid fuel stoves | 0,5 | 1.0 + 100 m 3 |
| Bathroom, shower room, toilet, shared bathroom | 0,5 | 25 m 3 |
| Sauna | 0,5 | 10 m 3 for 1 person |
| Elevator engine room | - | By calculation |
| Parking | 1,0 | By calculation |
| Garbage chamber | 1,0 | 1,0 |
The air exchange rate in all ventilated rooms not listed in the table in non-operating mode should be at least 0.2 room volume per hour.
9.3 In the course of thermotechnical calculation of enclosing structures of residential buildings, the temperature of the internal air of heated premises should be taken as at least 20 °C.
9.4 The heating and ventilation system of the building should be designed to ensure that the indoor air temperature during the heating period is within the optimal parameters established by GOST 30494, with the design parameters of the outdoor air for the respective construction areas.
From this it can be seen that, firstly, the concepts of the maintenance mode of the premises and the non-working mode appear, during which, as a rule, very different quantitative requirements are imposed on air exchange. For residential premises (bedrooms, common rooms, children's rooms), which make up a significant part of the area of the apartment, the air exchange rates under different modes differ by 5 times. The air temperature in the premises when calculating the heat losses of the designed building should be taken at least 20°C. In residential premises, the frequency of air exchange is normalized, regardless of the area and number of residents.
The updated version of SP 54.13330.2011 partially reproduces the information of SNiP 31-01-2003 in the original version. Air exchange rates for bedrooms, common rooms, children's rooms with a total area of \u200b\u200bthe apartment per person less than 20 m 2 - 3 m 3 / h per 1 m 2 of room area; the same when the total area of the apartment per person is more than 20 m 2 - 30 m 3 / h per person, but not less than 0.35 h -1; for a kitchen with electric stoves 60 m 3 / h, for a kitchen with a gas stove 100 m 3 / h.
Therefore, to determine the average daily hourly air exchange, it is necessary to assign the duration of each of the modes, determine the air flow in different rooms during each mode and then calculate the average hourly need for fresh air in the apartment, and then the house as a whole. Multiple changes in air exchange in a particular apartment during the day, for example, in the absence of people in the apartment during working hours or on weekends, will lead to a significant unevenness of air exchange during the day. At the same time, it is obvious that the non-simultaneous operation of these modes in different apartments will lead to equalization of the house load for ventilation needs and to a non-additive addition of this load for different consumers.
It is possible to draw an analogy with the non-simultaneous use of the DHW load by consumers, which obliges to introduce the coefficient of hourly unevenness when determining the DHW load for the heat source. As you know, its value for a significant number of consumers in the regulatory documentation is taken equal to 2.4. A similar value for the ventilation component of the heating load allows us to assume that the corresponding total load will also in fact decrease by at least 2.4 times due to the non-simultaneous opening of vents and windows in different residential buildings. In public and industrial buildings, a similar picture is observed with the difference that during non-working hours ventilation is minimal and is determined only by infiltration through leaks in skylights and external doors.
Accounting for the thermal inertia of buildings also makes it possible to focus on the average daily values of thermal energy consumption for air heating. Moreover, in most heating systems there are no thermostats that maintain the air temperature in the premises. It is also known that the central control of the temperature of the network water in the supply line for heating systems is carried out according to the outdoor temperature, averaged over a period of about 6-12 hours, and sometimes for more time.
Therefore, it is necessary to perform calculations of the normative average air exchange for residential buildings of different series in order to clarify the calculated heating load of buildings. Similar work needs to be done for public and industrial buildings.
It should be noted that these current regulatory documents apply to newly designed buildings in terms of designing ventilation systems for premises, but indirectly they not only can, but should also be a guide to action when clarifying the thermal loads of all buildings, including those that were built according to other standards listed above.
The standards of organizations regulating the norms of air exchange in the premises of multi-apartment residential buildings have been developed and published. For example, STO NPO AVOK 2.1-2008, STO SRO NP SPAS-05-2013, Energy saving in buildings. Calculation and design of residential ventilation systems apartment buildings(Approved by the general meeting of SRO NP SPAS dated March 27, 2014).
Basically, in these documents, the standards cited correspond to SP 54.13330.2011, with some reductions in individual requirements (for example, for a kitchen with a gas stove, a single air exchange is not added to 90 (100) m 3 / h, during non-working hours in a kitchen of this type, air exchange is allowed 0 .5 h -1, while in SP 54.13330.2011 - 1.0 h -1).
Reference Appendix B STO SRO NP SPAS-05-2013 provides an example of calculating the required air exchange for a three-room apartment.
Initial data:
The total area of the apartment F total \u003d 82.29 m 2;
The area of residential premises F lived \u003d 43.42 m 2;
Kitchen area - F kx \u003d 12.33 m 2;
Bathroom area - F ext \u003d 2.82 m 2;
The area of the restroom - F ub \u003d 1.11 m 2;
Room height h = 2.6 m;
The kitchen has an electric stove.
Geometric characteristics:
The volume of heated premises V \u003d 221.8 m 3;
The volume of residential premises V lived \u003d 112.9 m 3;
Kitchen volume V kx \u003d 32.1 m 3;
The volume of the restroom V ub \u003d 2.9 m 3;
The volume of the bathroom V ext \u003d 7.3 m 3.
From the above calculation of air exchange, it follows that the ventilation system of the apartment must provide the calculated air exchange in the maintenance mode (in the design operation mode) - L tr work \u003d 110.0 m 3 / h; in idle mode - L tr slave \u003d 22.6 m 3 / h. The given air flow rates correspond to the air exchange rate of 110.0/221.8=0.5 h -1 for the service mode and 22.6/221.8=0.1 h -1 for the off mode.
The information provided in this section shows that in existing normative documents with different occupancy of apartments, the maximum air exchange rate is in the range of 0.35 ... 0.5 h -1 according to the heated volume of the building, in non-working mode - at the level of 0.1 h -1. This means that when determining the power of the heating system that compensates for the transmission losses of thermal energy and the costs of heating the outside air, as well as the consumption of network water for heating needs, one can focus in the first approximation on the daily average value of the air exchange rate of residential multi-apartment buildings 0.35 h - one .
Analysis of energy passports of residential buildings developed in accordance with SNiP 23-02-2003 “ Thermal protection buildings”, shows that when calculating the heating load of a house, the air exchange rate corresponds to the level of 0.7 h -1, which is 2 times higher than the value recommended above, which does not contradict the requirements of modern service stations.
It is necessary to clarify the heating load of buildings built according to standard projects, based on the reduced average value of the air exchange rate, which will comply with the existing Russian standards and will make it possible to approach the standards of a number of EU countries and the USA.
7. Rationale for lowering the temperature graph
Section 1 shows that the temperature graph of 150-70 °C, due to the actual impossibility of its use in modern conditions, should be lowered or modified by justifying the “cutoff” in temperature.
The above calculations of various modes of operation of the heat supply system in off-design conditions allow us to propose the following strategy for making changes to the regulation of the heat load of consumers.
1. For the transitional period, introduce a temperature chart of 150-70 °С with a “cutoff” of 115 °С. With such a schedule, the consumption of network water in the heating network for heating, ventilation needs to be maintained at the current level corresponding to the design value, or with a slight excess, based on the performance of the installed network pumps. In the range of outdoor air temperatures corresponding to the “cutoff”, consider the calculated heating load of consumers reduced in comparison with the design value. The decrease in the heating load is attributed to the reduction in the cost of thermal energy for ventilation, based on the provision of the necessary average daily air exchange of residential multi-apartment buildings according to modern standards at the level of 0.35 h -1 .
2. Organize work to clarify the loads of building heating systems by developing energy passports for residential buildings, public organizations and enterprises, paying attention, first of all, to the ventilation load of buildings, which is included in the load of heating systems, taking into account modern regulatory requirements for room air exchange. To this end, it is necessary for houses of different heights, first of all, standard series carry out the calculation of heat losses, both transmission and ventilation in accordance with the modern requirements of the regulatory documentation of the Russian Federation.
3. On the basis of full-scale tests, take into account the duration of the characteristic modes of operation of ventilation systems and the non-simultaneity of their operation for different consumers.
4. After clarifying the thermal loads of consumer heating systems, develop a schedule for regulating the seasonal load of 150-70 °С with a “cutoff” by 115°С. The possibility of switching to the classic schedule of 115-70 °С without “cutting off” with high-quality regulation should be determined after clarifying the reduced heating loads. Specify the temperature of the return network water when developing a reduced schedule.
5. Recommend to designers, developers of new residential buildings and repair organizations that carry out major repairs of old housing stock, the use of modern ventilation systems that allow the regulation of air exchange, including mechanical ones with systems for recovering the thermal energy of polluted air, as well as the introduction of thermostats to adjust the power of devices heating.
Literature
1. Sokolov E.Ya. Heat supply and heat networks, 7th ed., M.: MPEI Publishing House, 2001
2. Gershkovich V.F. “One hundred and fifty ... Norm or bust? Reflections on the parameters of the coolant…” // Energy saving in buildings. - 2004 - No. 3 (22), Kyiv.
3. Internal sanitary devices. At 3 p.m. Part 1 Heating / V.N. Bogoslovsky, B.A. Krupnov, A.N. Scanavi and others; Ed. I.G. Staroverov and Yu.I. Schiller, - 4th ed., Revised. and additional - M.: Stroyizdat, 1990. -344 p.: ill. – (Designer's Handbook).
4. Samarin O.D. Thermophysics. Energy saving. Energy efficiency / Monograph. M.: DIA Publishing House, 2011.
6. A.D. Krivoshein, Energy saving in buildings: translucent structures and ventilation of premises // Architecture and construction of the Omsk region, No. 10 (61), 2008
7. N.I. Vatin, T.V. Samoplyas “Ventilation systems for residential premises of apartment buildings”, St. Petersburg, 2004
What laws are subject to changes in the temperature of the coolant in central heating systems? What is it - the temperature graph of the heating system 95-70? How to bring the heating parameters in accordance with the schedule? Let's try to answer these questions.
What it is
Let's start with a couple of abstract theses.
- With change weather conditions heat losses of any building change after them. In frosts, in order to maintain a constant temperature in the apartment, much more thermal energy is required than in warm weather.
To clarify: heat costs are determined not by the absolute value of the air temperature in the street, but by the delta between the street and the interior.
So, at +25C in the apartment and -20 in the yard, the heat costs will be exactly the same as at +18 and -27, respectively.
- The heat flow from the heater at a constant coolant temperature will also be constant.
A drop in room temperature will slightly increase it (again, due to an increase in the delta between the coolant and the air in the room); however, this increase will be categorically insufficient to compensate for the increased heat loss through the building envelope. Simply because the current SNiP limits the lower temperature threshold in an apartment to 18-22 degrees.
An obvious solution to the problem of increasing losses is to increase the temperature of the coolant.
Obviously, its growth should be proportional to the decrease in street temperature: the colder it is outside the window, the greater the heat loss will have to be compensated. Which, in fact, brings us to the idea of creating a specific table for matching both values.
So, the temperature chart of the heating system is a description of the dependence of the temperatures of the supply and return pipelines on the current weather outside.
How it all works
There are two different types charts:
- For heating networks.
- For domestic heating system.

To clarify the difference between these concepts, it is probably worth starting with a brief digression into how central heating works.
CHP - heat networks
The function of this bundle is to heat the coolant and deliver it to the end user. The length of heating mains is usually measured in kilometers, the total surface area - in thousands and thousands of square meters. Despite the measures for thermal insulation of pipes, heat losses are inevitable: having passed the path from the CHP or boiler house to the border of the house, the process water will have time to partially cool down.
Hence the conclusion: in order for it to reach the consumer, while maintaining an acceptable temperature, the supply of the heating main at the exit from the CHP should be as hot as possible. The limiting factor is the boiling point; however, with increasing pressure, it shifts in the direction of increasing temperature:
| Pressure, atmospheres | Boiling point, degrees Celsius |
| 1 | 100 |
| 1,5 | 110 |
| 2 | 119 |
| 2,5 | 127 |
| 3 | 132 |
| 4 | 142 |
| 5 | 151 |
| 6 | 158 |
| 7 | 164 |
| 8 | 169 |
Typical pressure in the supply pipeline of the heating main is 7-8 atmospheres. This value, even taking into account pressure losses during transportation, allows you to start the heating system in houses up to 16 floors high without additional pumps. At the same time, it is safe for routes, risers and inlets, mixer hoses and other elements of heating and hot water systems.

With some margin, the upper limit of the supply temperature is taken equal to 150 degrees. The most typical heating temperature curves for heating mains lie in the range of 150/70 - 105/70 (supply and return temperatures).
House
There are a number of additional limiting factors in the home heating system.
- The maximum temperature of the coolant in it cannot exceed 95 C for a two-pipe and 105 C for.
By the way: in preschool educational institutions, the restriction is much more stringent - 37 C.
Cost of lowering the supply temperature - increasing the number of radiator sections: in northern regions countries where groups are placed in kindergartens are literally surrounded by them.

- The temperature delta between the supply and return pipelines, for obvious reasons, should be as small as possible - otherwise the temperature of the batteries in the building will vary greatly. This implies a fast circulation of the coolant.
However, too fast circulation through house system heating will lead to the fact that the return water will return to the route with an exorbitantly high temperature, which, due to a number of technical limitations in the operation of the CHP, is unacceptable.
The problem is solved by installing one or more elevator units in each house, in which the return flow is mixed with the water stream from the supply pipeline. The resulting mixture, in fact, ensures the rapid circulation of a large volume of coolant without overheating the return pipeline of the route.

For intra-house networks, a separate temperature graph is set, taking into account the elevator operation scheme. For two-pipe circuits, a typical heating temperature graph is 95-70, for single-pipe circuits (which, however, is rare in apartment buildings) - 105-70.
Climate zones
The main factor that determines the scheduling algorithm is the estimated winter temperature. The heat carrier temperature table should be drawn up in such a way that the maximum values \u200b\u200b(95/70 and 105/70) at the peak of frost provide the temperature in residential premises corresponding to SNiP.
Here is an example of an intra-house schedule for the following conditions:
- Heating devices - radiators with a coolant supply from the bottom up.
- Heating - two-pipe, co.

- The estimated outdoor air temperature is -15 C.
| Outside air temperature, С | Submission, C | Return, C |
| +10 | 30 | 25 |
| +5 | 44 | 37 |
| 0 | 57 | 46 |
| -5 | 70 | 54 |
| -10 | 83 | 62 |
| -15 | 95 | 70 |
Nuance: when determining the parameters of the route and the in-house heating system, the average daily temperature is taken.
If it is -15 at night and -5 during the day, -10C appears as the outside temperature.
And here are some values of calculated winter temperatures for Russian cities.
| City | Design temperature, С |
| Arkhangelsk | -18 |
| Belgorod | -13 |
| Volgograd | -17 |
| Verkhoyansk | -53 |
| Irkutsk | -26 |
| Krasnodar | -7 |
| Moscow | -15 |
| Novosibirsk | -24 |
| Rostov-on-Don | -11 |
| Sochi | +1 |
| Tyumen | -22 |
| Khabarovsk | -27 |
| Yakutsk | -48 |

In the photo - winter in Verkhoyansk.
Adjustment
If the management of the CHPP and heating networks is responsible for the parameters of the route, then the responsibility for the parameters of the intra-house network rests with the residents. A very typical situation is when, when residents complain about the cold in apartments, measurements show downward deviations from the schedule. It happens a little less often that measurements in the wells of heat pumps show an overestimated return temperature from the house.
How to bring the heating parameters in line with the schedule with your own hands?
Nozzle reaming
With low mixture and return temperatures, the obvious solution is to increase the diameter of the elevator nozzle. How it's done?
The instruction is at the service of the reader.
- All valves or gates in the elevator unit are closed (inlet, house and hot water).
- The elevator is dismantled.
- The nozzle is removed and reamed by 0.5-1 mm.
- The elevator is assembled and started with air bleeding in the reverse order.
Tip: instead of paronite gaskets on the flanges, you can put rubber ones cut to the size of the flange from the car chamber.

An alternative is to install an elevator with an adjustable nozzle.
Suction suppression
In a critical situation (strong cold and freezing apartments), the nozzle can be completely removed. So that the suction does not become a jumper, it is suppressed with a pancake from steel sheet not less than a millimeter thick.

Attention: this is an emergency measure applied in extreme cases, since in this case the temperature of the radiators in the house can reach 120-130 degrees.
Differential adjustment
At elevated temperatures, as a temporary measure until the end of the heating season, it is practiced to adjust the differential on the elevator with a valve.
- The DHW is switched to the supply pipe.
- A manometer is installed on the return.
- The inlet gate valve on the return pipeline closes completely and then gradually opens with pressure control on the pressure gauge. If you just close the valve, the subsidence of the cheeks on the stem can stop and unfreeze the circuit. The difference is reduced by increasing the return pressure by 0.2 atmospheres per day with daily temperature control.

Conclusion
Economical energy consumption in the heating system can be achieved if certain requirements are met. One of the options is the presence of a temperature diagram, which reflects the ratio of the temperature emanating from the heating source to the external environment. The value of the values makes it possible to optimally distribute heat and hot water to the consumer.
High-rise buildings are connected mainly to central heating. Sources that convey thermal energy, are boiler houses or CHP. Water is used as a heat carrier. It is heated to a predetermined temperature.
Having passed a full cycle through the system, the coolant, already cooled, returns to the source and reheating begins. Sources are connected to the consumer by thermal networks. Since the environment changes the temperature regime, thermal energy should be regulated so that the consumer receives the required volume.
The regulation of heat from the central system can be done in two ways:
- Quantitative. In this form, the flow rate of water changes, but the temperature is constant.
- Qualitative. The temperature of the liquid changes, but its flow rate does not change.
In our systems, the second variant of regulation is used, that is, qualitative. Z Here there is a direct relationship between two temperatures: coolant and environment. And the calculation is carried out in such a way as to provide heat in the room of 18 degrees and above.
Hence, we can say that the temperature curve of the source is a broken curve. The change in its directions depends on the temperature difference (coolant and outside air).
Dependency graph may vary.
A particular chart has a dependency on:
- Technical and economic indicators.
- Equipment for a CHP or boiler room.
- climate.
High performance of the coolant provides the consumer with a large thermal energy.
An example of a circuit is shown below, where T1 is the temperature of the coolant, Tnv is the outdoor air:
It is also used, the diagram of the returned coolant. A boiler house or CHP according to such a scheme can evaluate the efficiency of the source. It is considered high when the returned liquid arrives cooled.
The stability of the scheme depends on the design values of the liquid flow of high-rise buildings. If the flow rate through the heating circuit increases, the water will return uncooled, as the flow rate will increase. Conversely, at a minimum flow, the return water will be sufficiently cooled.
The supplier's interest is, of course, in the flow of return water in a chilled state. But there are certain limits to reduce the flow, since a decrease leads to losses in the amount of heat. The consumer will begin to lower the internal degree in the apartment, which will lead to a violation of building codes and discomfort to the inhabitants.
What does it depend on?
The temperature curve depends on two quantities: outside air and coolant. Frosty weather leads to an increase in the degree of coolant. When designing a central source, the size of the equipment, the building and the section of pipes are taken into account.
The value of the temperature leaving the boiler room is 90 degrees, so that at minus 23°C, it would be warm in the apartments and have a value of 22°C. Then the return water returns to 70 degrees. Such norms correspond to normal and comfortable living in the house.
Analysis and adjustment of operating modes is carried out using a temperature scheme. For example, the return of a liquid with an elevated temperature will indicate high coolant costs. Underestimated data will be considered as a consumption deficit.
Previously, for 10-storey buildings, a scheme with calculated data of 95-70°C was introduced. The buildings above had their chart 105-70°C. Modern new buildings may have a different scheme, at the discretion of the designer. More often, there are diagrams of 90-70°C, and maybe 80-60°C.
Temperature chart 95-70:
 Temperature chart 95-70
 How is it calculated?
The control method is selected, then the calculation is made. The calculation-winter and reverse order of water inflow, the amount of outside air, the order at the break point of the diagram are taken into account. There are two diagrams, where one of them considers only heating, the other one considers heating with hot water consumption.
For an example calculation, we will use methodological development Roskommunenergo.
The initial data for the heat generating station will be:
- Tnv- the amount of outside air.
- TVN- indoor air.
- T1- coolant from the source.
- T2- return flow of water.
- T3- the entrance to the building.
We will consider several options for supplying heat with a value of 150, 130 and 115 degrees.
At the same time, at the exit they will have 70 ° C.
The results obtained are brought into a single table for the subsequent construction of the curve:
So, we got three different schemes that can be taken as a basis. It would be more correct to calculate the diagram individually for each system. Here we considered the recommended values, without taking into account the climatic features of the region and the characteristics of the building.
To reduce power consumption, it is enough to choose a low-temperature order of 70 degrees and uniform distribution of heat throughout the heating circuit will be ensured. The boiler should be taken with a power reserve so that the load of the system does not affect the quality operation of the unit.
Adjustment
 Heating regulator
 Automatic control is provided by the heating regulator.
It includes the following details:
- Computing and matching panel.
- Executive device at the water supply line.
- Executive device, which performs the function of mixing liquid from the returned liquid (return).
- boost pump and a sensor on the water supply line.
- Three sensors (on the return line, on the street, inside the building). There may be several in a room.
The regulator covers the liquid supply, thereby increasing the value between the return and supply to the value provided by the sensors.
To increase the flow, there is a booster pump, and the corresponding command from the regulator. The incoming flow is regulated by a "cold bypass". That is, the temperature drops. Some of the liquid that circulates along the circuit is sent to the supply.
Information is taken by sensors and transmitted to control units, as a result of which, there is a redistribution of flows that provide rigid temperature chart heating systems.
Sometimes, a computing device is used, where the DHW and heating regulators are combined.
The hot water regulator has more a simple circuit management. The hot water sensor regulates the flow of water with a stable value of 50°C.
Regulator benefits:
- The temperature regime is strictly maintained.
- Exclusion of liquid overheating.
- Fuel economy and energy.
- The consumer, regardless of distance, receives heat equally.
Table with temperature chart
The operating mode of the boilers depends on the weather of the environment.
If we take different objects, for example, a factory room, a multi-storey building and a private house, all will have an individual thermal diagram.
In the table, we show the temperature diagram of the dependence of residential buildings on the outside air:
| Outside temperature | Temperature of network water in the supply pipeline | Temperature of network water in the return pipeline |
| +10 | 70 | 55 |
| +9 | 70 | 54 |
| +8 | 70 | 53 |
| +7 | 70 | 52 |
| +6 | 70 | 51 |
| +5 | 70 | 50 |
| +4 | 70 | 49 |
| +3 | 70 | 48 |
| +2 | 70 | 47 |
| +1 | 70 | 46 |
| 0 | 70 | 45 |
| -1 | 72 | 46 |
| -2 | 74 | 47 |
| -3 | 76 | 48 |
| -4 | 79 | 49 |
| -5 | 81 | 50 |
| -6 | 84 | 51 |
| -7 | 86 | 52 |
| -8 | 89 | 53 |
| -9 | 91 | 54 |
| -10 | 93 | 55 |
| -11 | 96 | 56 |
| -12 | 98 | 57 |
| -13 | 100 | 58 |
| -14 | 103 | 59 |
| -15 | 105 | 60 |
| -16 | 107 | 61 |
| -17 | 110 | 62 |
| -18 | 112 | 63 |
| -19 | 114 | 64 |
| -20 | 116 | 65 |
| -21 | 119 | 66 |
| -22 | 121 | 66 |
| -23 | 123 | 67 |
| -24 | 126 | 68 |
| -25 | 128 | 69 |
| -26 | 130 | 70 |
SNiP
There are certain norms that must be observed in the creation of projects for heating networks and the transportation of hot water to the consumer, where the supply of water vapor must be carried out at 400 ° C, at a pressure of 6.3 bar. The supply of heat from the source is recommended to be released to the consumer with values of 90/70 °C or 115/70 °C.
Regulatory requirements should be followed for compliance with the approved documentation with the obligatory coordination with the Ministry of Construction of the country.
We also recommend
 Switching power supply: repair and refinement
 Remote control of light
 Swimming lessons for preschool children
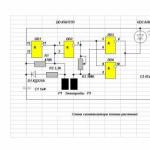 Notes for the master - home household alarms
 Clock propeller on Atmega8
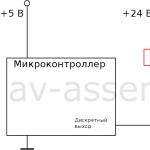 Device and relay application examples, how to choose and connect a relay correctly Microcontroller and relay simple switching circuits