Calculation of the temperature graph of the heating system. The dependence of the coolant temperature on the outside air temperature
Economical energy consumption in the heating system can be achieved if certain requirements are met. One of the options is the presence of a temperature chart, which reflects the ratio of the temperature emanating from the heating source to external environment. The value of the values makes it possible to optimally distribute heat and hot water to the consumer.
High-rise buildings are connected mainly to central heating. Sources that convey thermal energy, are boiler houses or CHP. Water is used as a heat carrier. It is heated to a predetermined temperature.
Having passed a full cycle through the system, the coolant, already cooled, returns to the source and reheating begins. Sources are connected to the consumer by thermal networks. Since the environment changes the temperature regime, thermal energy should be regulated so that the consumer receives the required volume.
The regulation of heat from the central system can be done in two ways:
- Quantitative. In this form, the flow rate of water changes, but the temperature is constant.
- Qualitative. The temperature of the liquid changes, but its flow rate does not change.
In our systems, the second variant of regulation is used, that is, qualitative. W Here there is a direct relationship between two temperatures: coolant and environment. And the calculation is carried out in such a way as to provide heat in the room of 18 degrees and above.
Hence, we can say that the temperature curve of the source is a broken curve. The change in its directions depends on the temperature difference (coolant and outside air).
Dependency graph may vary.
A particular chart has a dependency on:
- Technical and economic indicators.
- Equipment for a CHP or boiler room.
- climate.
High performance of the coolant provides the consumer with a large thermal energy.
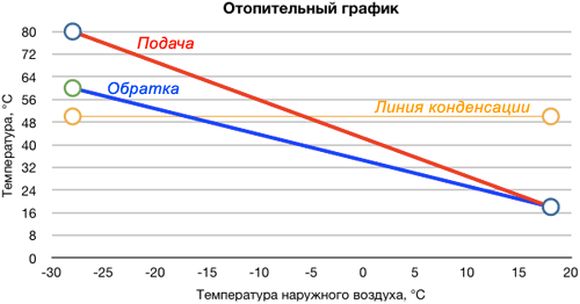
An example of a circuit is shown below, where T1 is the temperature of the coolant, Tnv is the outdoor air:
It is also used, the diagram of the returned coolant. A boiler house or CHP according to such a scheme can evaluate the efficiency of the source. It is considered high when the returned liquid arrives cooled.
The stability of the scheme depends on the design values of the liquid flow of high-rise buildings. If the flow rate through the heating circuit increases, the water will return uncooled, as the flow rate will increase. Conversely, at a minimum flow, the return water will be sufficiently cooled.
The supplier's interest is, of course, in the flow of return water in a chilled state. But there are certain limits to reduce the flow, since a decrease leads to losses in the amount of heat. The consumer will begin to lower the internal degree in the apartment, which will lead to a violation of building codes and discomfort to the inhabitants.
What does it depend on?
The temperature curve depends on two quantities: outside air and coolant. Frosty weather leads to an increase in the degree of coolant. When designing a central source, the size of the equipment, the building and the section of pipes are taken into account.
The value of the temperature leaving the boiler room is 90 degrees, so that at minus 23°C, it would be warm in the apartments and have a value of 22°C. Then the return water returns to 70 degrees. Such norms correspond to normal and comfortable living in the house.
Analysis and adjustment of operating modes is carried out using a temperature scheme. For example, the return of a liquid with an elevated temperature will speak of high costs coolant. Underestimated data will be considered as a consumption deficit.
Previously, for 10-storey buildings, a scheme with calculated data of 95-70°C was introduced. The buildings above had their chart 105-70°C. Modern new buildings may have a different scheme, at the discretion of the designer. More often, there are diagrams of 90-70°C, and maybe 80-60°C.
Temperature chart 95-70:
 Temperature chart 95-70
 How is it calculated?
The control method is selected, then the calculation is made. The settlement-winter and reverse order water inflows, the amount of outside air, the order at the breakpoint of the diagram. There are two diagrams, where one of them considers only heating, the other one considers heating with hot water consumption.
For an example calculation, we will use methodological development Roskommunenergo.
The initial data for the heat generating station will be:
- Tnv- the amount of outside air.
- TVN- indoor air.
- T1- coolant from the source.
- T2- return flow of water.
- T3- the entrance to the building.
We will consider several options for supplying heat with a value of 150, 130 and 115 degrees.
At the same time, at the exit they will have 70 ° C.
The results obtained are brought into a single table for the subsequent construction of the curve:
So, we got three different schemes that can be taken as a basis. It would be more correct to calculate the diagram individually for each system. Here we considered the recommended values, without taking into account the climatic features of the region and the characteristics of the building.
To reduce power consumption, it is enough to choose a low-temperature order of 70 degrees and will ensure uniform distribution of heat throughout heating circuit. The boiler should be taken with a power reserve so that the load of the system does not affect the quality operation of the unit.
Adjustment
 Heating regulator
 Automatic control is provided by the heating regulator.
It includes the following details:
- Computing and matching panel.
- Executive device at the water supply line.
- Executive device, which performs the function of mixing liquid from the returned liquid (return).
- boost pump and a sensor on the water supply line.
- Three sensors (on the return line, on the street, inside the building). There may be several in a room.
The regulator covers the liquid supply, thereby increasing the value between the return and supply to the value provided by the sensors.
To increase the flow, there is a booster pump, and the corresponding command from the regulator. The incoming flow is regulated by a "cold bypass". That is, the temperature drops. Some of the liquid that circulates along the circuit is sent to the supply.
Information is taken by sensors and transmitted to control units, as a result of which flows are redistributed, which provide a rigid temperature scheme for the heating system.
Sometimes, a computing device is used, where the DHW and heating regulators are combined.
The hot water regulator has more a simple circuit management. The hot water sensor regulates the flow of water with a stable value of 50°C.
Regulator benefits:
- hard aged temperature scheme.
- Exclusion of liquid overheating.
- Fuel Economy and energy.
- The consumer, regardless of distance, receives heat equally.
Table with temperature chart
The operating mode of the boilers depends on the weather of the environment.
If we take various objects, for example, a factory building, a multi-storey building and private house, all will have an individual heat chart.
In the table we show the temperature dependence scheme residential buildings from outside air:
| Outside temperature | Temperature of network water in the supply pipeline | Temperature of network water in the return pipeline |
| +10 | 70 | 55 |
| +9 | 70 | 54 |
| +8 | 70 | 53 |
| +7 | 70 | 52 |
| +6 | 70 | 51 |
| +5 | 70 | 50 |
| +4 | 70 | 49 |
| +3 | 70 | 48 |
| +2 | 70 | 47 |
| +1 | 70 | 46 |
| 0 | 70 | 45 |
| -1 | 72 | 46 |
| -2 | 74 | 47 |
| -3 | 76 | 48 |
| -4 | 79 | 49 |
| -5 | 81 | 50 |
| -6 | 84 | 51 |
| -7 | 86 | 52 |
| -8 | 89 | 53 |
| -9 | 91 | 54 |
| -10 | 93 | 55 |
| -11 | 96 | 56 |
| -12 | 98 | 57 |
| -13 | 100 | 58 |
| -14 | 103 | 59 |
| -15 | 105 | 60 |
| -16 | 107 | 61 |
| -17 | 110 | 62 |
| -18 | 112 | 63 |
| -19 | 114 | 64 |
| -20 | 116 | 65 |
| -21 | 119 | 66 |
| -22 | 121 | 66 |
| -23 | 123 | 67 |
| -24 | 126 | 68 |
| -25 | 128 | 69 |
| -26 | 130 | 70 |
SNiP
There are certain norms that must be observed in the creation of projects for heating networks and the transportation of hot water to the consumer, where the supply of water vapor must be carried out at 400 ° C, at a pressure of 6.3 bar. The supply of heat from the source is recommended to be released to the consumer with values of 90/70 °C or 115/70 °C.
Regulatory requirements should be followed for compliance with the approved documentation with the obligatory coordination with the Ministry of Construction of the country.
Each Management Company strive to achieve economical heating costs apartment building. In addition, residents of private houses are trying to come. This can be achieved if a temperature graph is drawn up, which will reflect the dependence of the heat produced by the carriers on weather conditions on the street. Correct use of these data allow optimal distribution of hot water and heating to consumers.
What is a temperature chart
The same mode of operation should not be maintained in the coolant, because outside the apartment the temperature changes. It is she who needs to be guided and, depending on her, change the temperature of the water in heating objects. The dependence of the coolant temperature on outdoor temperature air is compiled by technologists. To compile it, the values \u200b\u200bof the coolant and the outside air temperature are taken into account.
During the design of any building, the size of the heating equipment supplied in it, the dimensions of the building itself and the cross-sections of the pipes must be taken into account. In a high-rise building, residents cannot independently increase or decrease the temperature, as it is supplied from the boiler room. Adjustment of the operating mode is always carried out taking into account temperature chart coolant. The temperature scheme itself is also taken into account - if the return pipe supplies water with a temperature above 70 ° C, then the coolant flow will be excessive, but if it is much lower, there is a shortage.
Important! The temperature schedule is drawn up in such a way that at any outdoor air temperature in the apartments a stable optimal heating level of 22 °C is maintained. Thanks to him, even the most severe frosts become not terrible, because the heating systems will be ready for them. If it is -15 ° C outside, then it is enough to track the value of the indicator to find out what the water temperature in the heating system will be at that moment. The more severe the outdoor weather, the hotter the water inside the system should be.
But the level of heating maintained indoors depends not only on the coolant:
- Temperature outside;
- The presence and strength of the wind - its strong gusts significantly affect heat loss;
- Thermal insulation - high-quality processed structural parts of the building help to keep heat in the building. This is done not only during the construction of the house, but also separately at the request of the owners.
Heat carrier temperature table from outdoor temperature
In order to calculate the optimal temperature regime, it is necessary to take into account the characteristics that heating devices have - batteries and radiators. The most important thing is to calculate their specific power, it will be expressed in W / cm 2. This will most directly affect the transfer of heat from the heated water to the heated air in the room. It is important to take into account their surface power and the drag coefficient available for window openings and outer walls.
After all the values \u200b\u200bare taken into account, you need to calculate the difference between the temperature in the two pipes - at the entrance to the house and at the exit from it. The higher the value in the inlet pipe, the higher in the return pipe. Accordingly, indoor heating will increase below these values.
| Weather outside, С | at the entrance to the building, C | Return pipe, C |
| +10 | 30 | 25 |
| +5 | 44 | 37 |
| 0 | 57 | 46 |
| -5 | 70 | 54 |
| -10 | 83 | 62 |
| -15 | 95 | 70 |
Proper use of the coolant implies attempts by the inhabitants of the house to reduce the temperature difference between the inlet and outlet pipes. It could be construction work for wall insulation from the outside or thermal insulation of external heat supply pipes, insulation of ceilings above a cold garage or basement, insulation of the inside of the house or several works performed simultaneously.
Heating in the radiator must also comply with the standards. In central heating systems, it usually varies from 70 C to 90 C, depending on the outside air temperature. It is important to bear in mind that in the corner rooms it cannot be less than 20 C, although in other rooms of the apartment it is allowed to drop to 18 C. If the temperature drops to -30 C outside, then the heating in the rooms should rise by 2 C. In other rooms it should also increase the temperature provided that the rooms for various purposes it may be different. If there is a child in the room, then it can range from 18 C to 23 C. In pantries and corridors, heating can vary from 12 C to 18 C.
It is important to note! taken into account average daily temperature- if the temperature is about -15 C at night, and -5 C during the day, then it will be considered by the value of -10 C. If at night it was about -5 C, and at daytime it rose to +5 C, then heating is taken into account at a value of 0 C.
Schedule for supplying hot water to the apartment
In order to deliver optimal hot water to the consumer, CHP plants must send it as hot as possible. Heating mains are always so long that their length can be measured in kilometers, and the length of apartments is measured in thousands. square meters. Whatever the thermal insulation of the pipes, heat is lost on the way to the user. Therefore, it is necessary to heat the water as much as possible. 
However, water cannot be heated to more than its boiling point. Therefore, a solution was found - to increase the pressure.
It's important to know! As it rises, the boiling point of water shifts upwards. As a result, it reaches the consumer really hot. With an increase in pressure, risers, mixers and taps do not suffer, and all apartments up to the 16th floor can be provided with hot water without additional pumps. In a heating main, water usually contains 7-8 atmospheres, the upper limit usually has 150 with a margin.
It looks like this:
| Boiling temperature | Pressure |
| 100 | 1 |
| 110 | 1,5 |
| 119 | 2 |
| 127 | 2,5 |
| 132 | 3 |
| 142 | 4 |
| 151 | 5 |
| 158 | 6 |
| 164 | 7 |
| 169 | 8 |
Hot water supply to winter time years must be continuous. Exceptions to this rule are accidents on heat supply. Hot water can only be turned off summer period for preventive work. Such work is carried out both in closed-type heating systems and in open-type systems.
The basis of an economical approach to energy consumption in a heating system of any type is the temperature graph. Its parameters indicate optimal value heating water, thereby optimizing costs. In order to apply these data in practice, it is necessary to learn more about the principles of its construction.
Terminology
Temperature graph - the optimal value of heating the coolant to create comfortable temperature in room. It consists of several parameters, each of which directly affects the quality of the entire heating system.
- The temperature in the inlet and outlet pipes of the heating boiler.
- The difference between these indicators of heating the coolant.
- Temperature indoors and outdoors.
The latter characteristics are decisive for the regulation of the first two. Theoretically, the need to increase the heating of water in the pipes comes with a decrease in the temperature outside. But how much should be increased so that the heating of the air in the room is optimal? To do this, draw up a graph of the dependence of the parameters of the heating system.
When calculating it, the parameters of the heating system are taken into account and residential building. For district heating, the following temperature parameters systems:
- 150°C/70°C. Before reaching the users, the coolant is diluted with water from the return pipe to normalize the incoming temperature.
- 90°C/70°C. In this case, there is no need to install equipment for mixing streams.
According to the current parameters of the system, utilities must monitor compliance with the heating medium heating value in the return pipe. If this parameter is less than normal, it means that the room is not warming up properly. The excess indicates the opposite - the temperature in the apartments is too high.
Temperature chart for a private house
The practice of drawing up such a schedule for autonomous heating not very developed. This is due to its fundamental difference from the centralized one. It is possible to control the water temperature in the pipes in manual and automatic mode. If during design and practical implementation If the installation of sensors for automatic control of the operation of the boiler and thermostats in each room was taken into account, then there will be no urgent need to calculate the temperature schedule.
But for calculating future expenses depending on weather conditions, it will be indispensable. In order to make it according to the current rules, the following conditions must be taken into account:

Only after these conditions are met, you can proceed to the calculation part. At this stage, difficulties may arise. The correct calculation of an individual temperature graph is a complex mathematical scheme that takes into account all possible indicators.
However, to facilitate the task, there are ready-made tables with indicators. Below are examples of the most common modes of operation of heating equipment. The following input data were taken as initial conditions:
- The minimum air temperature outside is 30°С
- The optimum room temperature is +22°C.
Based on these data, schedules were drawn up for the following types of heating systems.

It is worth remembering that these data do not take into account the design features of the heating system. They only show the recommended values \u200b\u200bof the temperature and power of heating equipment, depending on weather conditions.
Today, the most common heating systems in the Federation are those operating on water. The temperature of the water in the batteries directly depends on the indicators of the air temperature outside, that is, on the street, in a certain period of time. A corresponding schedule has also been legally approved, according to which responsible specialists temperatures are calculated taking into account local weather conditions and the source of heat supply.
The graphs of the coolant temperature depending on the outside temperature are developed taking into account the support of the mandatory temperature conditions in the room, those that are considered optimal and comfortable for the average person.
The colder it is outside, the higher the level of heat loss. For this reason, it is important to know which indicators are applicable when calculating the desired indicators. You don't need to calculate anything yourself. All figures are approved by the relevant normative documents. They are based on the average temperatures of the five coldest days of the year. The period of the last fifty years is also taken, with the selection of the eight coldest winters for a given time.
Thanks to such calculations, it is possible to prepare for low temperatures winter, occurring at least once every few years. In turn, this allows you to significantly save when creating a heating system.
Dear readers!
Our articles talk about typical ways legal issues, but each case is unique. If you want to know how to solve your particular problem, please use the online consultant form on the right →
It's fast and free! Or give us a call (24/7):
Additional influencing factors
The coolant temperatures themselves are also directly affected by such no less significant factors as:
- Lowering the temperature on the street, which entails a similar indoor;
- Wind speed - the higher it is, the greater the heat loss through front door, window;
- Tightness of walls and joints (installation plastic windows and insulation of facades significantly affects the preservation of heat).
 Recently, there have been some changes in building codes. For this reason construction companies often carry out thermal insulation work not only on facades apartment buildings, but also in basements, foundation, roof, roofing. Accordingly, the cost of such construction projects increases. At the same time, it is important to know that the costs of insulation are very significant, but on the other hand, this is a guarantee of heat savings and reduced heating costs.
For their part, construction companies understand that the costs incurred by them for the insulation of objects will be fully and soon paid off. It is also beneficial for the owners, since utility bills are very high, and if you pay, then it is really for the received and stored heat, and not for its loss due to insufficient insulation of the premises.
Temperature in the radiator
However, no matter what the weather conditions are outside and how insulated it is, the most important role is still played by the heat transfer of the radiator. Typically, in central heating systems, temperatures range from 70 to 90 degrees. However, it is important to take into account the fact that this criterion is not the only one in order to have the desired temperature regime, especially in residential premises, where temperatures in each individual room should not be the same, depending on the purpose.
 So, for example, in corner rooms there should not be less than 20 degrees, while in others 18 degrees are allowed. In addition, if the temperature outside drops to -30, the established norms for rooms should be two degrees higher.
Those rooms that are intended for children should have a temperature limit of 18 to 23 degrees, depending on what they are intended for. So in the pool it cannot be less than 30 degrees, and on the veranda it must be at least 12 degrees.
Talking about school educational institution, there should not be below 21 degrees, and in the boarding school bedroom - at least 16 degrees. For a cultural mass institution, the norm is from 16 degrees to 21, and for a library - no more than 18 degrees.
What affects battery temperature?
In addition to the heat transfer of the coolant and the temperatures outside, the heat in the room also depends on the activity of people inside. The more movements a person makes, the lower the temperature can be and vice versa. This must also be taken into account when distributing heat. As an example, you can take any sports institution where people are a priori in active movement. It is not advisable to maintain high temperatures here, as this will cause discomfort. Accordingly, an indicator of 18 degrees is optimal.
It can be noted that the thermal performance of batteries inside any premises is affected not only by the outside air temperature and wind speed, but also by:

Approved schedules
Since the temperature outside has a direct impact on the heat inside the premises, a special temperature chart has been approved.
| Temperature readings outside | Inlet water, °C | Water in the heating system, °С | Outlet water, °С |
|---|---|---|---|
| 8 °C | from 51 to 52 | 42-45 | from 34 to 40 |
| 7 °C | from 51 to 55 | 44-47 | from 35 to 41 |
| 6 °C | from 53 to 57 | 45-49 | from 36 to 46 |
| 5 °С | from 55 to 59 | 47-50 | from 37 to 44 |
| 4 °С | from 57 to 61 | 48-52 | from 38 to 45 |
| 3 °С | from 59 to 64 | 50-54 | from 39 to 47 |
| 2 °C | from 61 to 66 | 51-56 | from 40 to 48 |
| 1 °C | from 63 to 69 | 53-57 | from 41 to 50 |
| 0 °С | from 65 to 71 | 55-59 | from 42 to 51 |
| -1 °C | from 67 to 73 | 56-61 | from 43 to 52 |
| -2 °С | from 69 to 76 | 58-62 | from 44 to 54 |
| -3 °С | from 71 to 78 | 59-64 | from 45 to 55 |
| -4 °С | from 73 to 80 | 61-66 | from 45 to 56 |
| -5 °С | from 75 to 82 | 62-67 | from 46 to 57 |
| -6 °С | from 77 to 85 | 64-69 | from 47 to 59 |
| -7 °С | from 79 to 87 | 65-71 | from 48 to 62 |
| -8 °С | from 80 to 89 | 66-72 | from 49 to 61 |
| -9 °C | from 82 to 92 | 66-72 | from 49 to 63 |
| -10 °C | from 86 to 94 | 69-75 | from 50 to 64 |
| -11 °C | from 86 to 96 | 71-77 | from 51 to 65 |
| -12 °C | from 88 to 98 | 72-79 | from 59 to 66 |
| -13 °C | from 90 to 101 | 74-80 | from 53 to 68 |
| -14 °C | from 92 to 103 | 75-82 | from 54 to 69 |
| -15 °С | from 93 to 105 | 76-83 | from 54 to 70 |
| -16 °С | from 95 to 107 | 79-86 | from 56 to 72 |
| -17 °С | from 97 to 109 | 79-86 | from 56 to 72 |
| -18 °C | from 99 to 112 | 81-88 | from 56 to 74 |
| -19 °С | from 101 to 114 | 82-90 | from 57 to 75 |
| -20 °С | from 102 to 116 | 83-91 | from 58 to 76 |
| -21 °С | from 104 to 118 | 85-93 | from 59 to 77 |
| -22 °С | from 106 to 120 | 88-94 | from 59 to 78 |
| -23 °C | from 108 to 123 | 87-96 | from 60 to 80 |
| -24 °С | from 109 to 125 | 89-97 | from 61 to 81 |
| -25 °С | from 112 to 128 | 90-98 | from 62 to 82 |
| -26 °С | from 112 to 128 | 91-99 | from 62 to 83 |
| -27 °С | from 114 to 130 | 92-101 | from 63 to 84 |
| -28 °С | from 116 to 134 | 94-103 | from 64 to 86 |
| -29 °C | from 118 to 136 | 96-105 | from 64 to 87 |
| -30 °C | from 120 to 138 | 97-106 | from 67 to 88 |
| -31 °С | from 122 to 140 | 98-108 | from 66 to 89 |
| -32 °С | from 123 to 142 | 100-109 | from 66 to 93 |
| -33 °С | from 125 to 144 | 101-111 | from 67 to 91 |
| -34 °C | from 127 to 146 | 102-112 | from 68 to 92 |
| -35 °С | from 129 to 149 | 104-114 | from 69 to 94 |
What is also important to know?
 Thanks to tabular data, it does not special work learn about the temperature indicators of water in systems central heating. The required part of the coolant is measured with an ordinary thermometer at the moment when the system is lowered. Identified inconsistencies in actual temperatures established standards is the basis for the recalculation of utility bills. General house meters for accounting for heat energy have become very relevant today.
The responsibility for the temperature of the water that is heated in the heating main lies with the local CHP or boiler house. Transportation of thermal carriers and minimal losses are assigned to the organization serving heating network. Serves and adjusts the elevator unit of the housing department or the management company.
It is important to know that the diameter of the elevator nozzle itself must be coordinated with the public heating network. All questions regarding low room temperature must be resolved with the governing body of the apartment building or other immovable object in question. The duty of these bodies is to provide citizens with minimum sanitary standards temperatures.
Norms in living quarters
To understand when it is really relevant to apply for recalculation of payment for public service and require the adoption of any measures to ensure heat, it is necessary to know the norms of heat in residential premises. These norms are fully regulated by Russian legislation.
So in the warm season, living quarters are not heated and the norms for them are 22-25 degrees Celsius. In cold weather, the following indicators apply:

However, do not forget about common sense. For example, bedrooms must be ventilated, they should not be too hot, but it cannot be cold either. Temperature regime in the children's room should be adjusted according to the age of the child. For babies, this is the upper limit. As they grow older, the bar decreases to the lower limits.
The heat in the bathroom also depends on the humidity of the room. If the room is poorly ventilated, there is a high water content in the air, and this creates a feeling of dampness and may not be safe for the health of residents.

Dear readers!
It's fast and free! Or give us a call (24/7).
What laws are subject to changes in the temperature of the coolant in central heating systems? What is it - the temperature graph of the heating system 95-70? How to bring the heating parameters in accordance with the schedule? Let's try to answer these questions.
What it is
Let's start with a couple of abstract theses.
- With changing weather conditions, the heat loss of any building changes after them.. In frosts, in order to maintain a constant temperature in the apartment, much more thermal energy is required than in warm weather.
To clarify: heat costs are determined not by the absolute value of the air temperature in the street, but by the delta between the street and the interior.
So, at +25C in the apartment and -20 in the yard, the heat costs will be exactly the same as at +18 and -27, respectively.
- The heat flow from the heater at a constant coolant temperature will also be constant.
A drop in room temperature will slightly increase it (again, due to an increase in the delta between the coolant and the air in the room); however, this increase will be categorically insufficient to compensate for the increased heat loss through the building envelope. Simply because the current SNiP limits the lower temperature threshold in an apartment to 18-22 degrees.
An obvious solution to the problem of increasing losses is to increase the temperature of the coolant.
Obviously, its growth should be proportional to the decrease in street temperature: the colder it is outside the window, the greater the heat loss will have to be compensated. Which, in fact, brings us to the idea of creating a specific table for matching both values.
So, the temperature chart of the heating system is a description of the dependence of the temperatures of the supply and return pipelines on the current weather outside.
How it all works
There are two different types charts:
- For heating networks.
- For domestic heating system.

To clarify the difference between these concepts, it is probably worth starting with a brief digression into how central heating works.
CHP - heat networks
The function of this bundle is to heat the coolant and deliver it to the end user. The length of heating mains is usually measured in kilometers, the total surface area - in thousands and thousands of square meters. Despite the measures for thermal insulation of pipes, heat losses are inevitable: having passed the path from the CHP or boiler house to the border of the house, industrial water cool down partially.
Hence the conclusion: in order for it to reach the consumer, while maintaining an acceptable temperature, the supply of the heating main at the exit from the CHP should be as hot as possible. The limiting factor is the boiling point; however, with increasing pressure, it shifts in the direction of increasing temperature:
| Pressure, atmospheres | Boiling point, degrees Celsius |
| 1 | 100 |
| 1,5 | 110 |
| 2 | 119 |
| 2,5 | 127 |
| 3 | 132 |
| 4 | 142 |
| 5 | 151 |
| 6 | 158 |
| 7 | 164 |
| 8 | 169 |
Typical pressure in the supply pipeline of the heating main is 7-8 atmospheres. This value, even taking into account pressure losses during transportation, allows you to start heating system in buildings up to 16 floors without additional pumps. At the same time, it is safe for routes, risers and inlets, mixer hoses and other elements of heating and hot water systems.

With some margin, the upper limit of the supply temperature is taken equal to 150 degrees. The most typical heating temperature curves for heating mains lie in the range of 150/70 - 105/70 (supply and return temperatures).
House
There are a number of additional limiting factors in the home heating system.
- The maximum temperature of the coolant in it cannot exceed 95 C for a two-pipe and 105 C for.
By the way: in preschool educational institutions, the restriction is much more stringent - 37 C.
Cost of lowering the supply temperature - increasing the number of radiator sections: in northern regions countries where groups are placed in kindergartens are literally surrounded by them.

- The temperature delta between the supply and return pipelines, for obvious reasons, should be as small as possible - otherwise the temperature of the batteries in the building will vary greatly. This implies a fast circulation of the coolant.
However, too fast circulation through house system heating will lead to the fact that the return water will return to the route with an exorbitantly high temperature, which, due to a number of technical limitations in the operation of the CHP, is unacceptable.
The problem is solved by installing one or more elevator units in each house, in which the return flow is mixed with the water stream from the supply pipeline. The resulting mixture, in fact, ensures the rapid circulation of a large volume of coolant without overheating the return pipeline of the route.

For intra-house networks, a separate temperature graph is set, taking into account the elevator operation scheme. For two-pipe circuits, a heating temperature graph of 95-70 is typical, for single-pipe circuits (which, however, is rare in apartment buildings) — 105-70.
Climate zones
The main factor that determines the scheduling algorithm is the estimated winter temperature. The heat carrier temperature table should be drawn up in such a way that the maximum values \u200b\u200b(95/70 and 105/70) at the peak of frost provide the temperature in residential premises corresponding to SNiP.
Here is an example of an intra-house schedule for the following conditions:
- Heating devices - radiators with a coolant supply from the bottom up.
- Heating - two-pipe, co.

- The estimated outdoor air temperature is -15 C.
| Outside air temperature, С | Submission, C | Return, C |
| +10 | 30 | 25 |
| +5 | 44 | 37 |
| 0 | 57 | 46 |
| -5 | 70 | 54 |
| -10 | 83 | 62 |
| -15 | 95 | 70 |
Nuance: when determining the parameters of the route and the in-house heating system, the average daily temperature is taken.
If it is -15 at night and -5 during the day, -10C appears as the outside temperature.
And here are some values of calculated winter temperatures for Russian cities.
| City | Design temperature, С |
| Arkhangelsk | -18 |
| Belgorod | -13 |
| Volgograd | -17 |
| Verkhoyansk | -53 |
| Irkutsk | -26 |
| Krasnodar | -7 |
| Moscow | -15 |
| Novosibirsk | -24 |
| Rostov-on-Don | -11 |
| Sochi | +1 |
| Tyumen | -22 |
| Khabarovsk | -27 |
| Yakutsk | -48 |

In the photo - winter in Verkhoyansk.
Adjustment
If the management of the CHPP and heating networks is responsible for the parameters of the route, then the responsibility for the parameters of the intra-house network rests with the residents. A very typical situation is when, when residents complain about the cold in apartments, measurements show downward deviations from the schedule. It happens a little less often that measurements in the wells of heat pumps show an overestimated return temperature from the house.
How to bring the heating parameters in line with the schedule with your own hands?
Nozzle reaming
With low mixture and return temperatures, the obvious solution is to increase the diameter of the elevator nozzle. How it's done?
The instruction is at the service of the reader.
- All valves or gates are closed in elevator node(input, house and hot water supply).
- The elevator is dismantled.
- The nozzle is removed and reamed by 0.5-1 mm.
- The elevator is assembled and started with air bleeding in the reverse order.
Tip: instead of paronite gaskets on the flanges, you can put rubber ones cut to the size of the flange from the car chamber.

An alternative is to install an elevator with an adjustable nozzle.
Suction suppression
In a critical situation (strong cold and freezing apartments), the nozzle can be completely removed. So that the suction does not become a jumper, it is suppressed with a pancake from steel sheet not less than a millimeter thick.

Attention: this is an emergency measure applied in extreme cases, since in this case the temperature of the radiators in the house can reach 120-130 degrees.
Differential adjustment
At elevated temperatures as a temporary measure until the end heating season practice is to adjust the differential on the elevator with a valve.
- The DHW is switched to the supply pipe.
- A manometer is installed on the return.
- The inlet gate valve on the return pipeline closes completely and then gradually opens with pressure control on the pressure gauge. If you just close the valve, the subsidence of the cheeks on the stem can stop and unfreeze the circuit. The difference is reduced by increasing the return pressure by 0.2 atmospheres per day with daily temperature control.