Quadratic function solution examples 9. Quadratic function and its graph
Important notes!
1. If instead of formulas you see abracadabra, clear the cache. How to do it in your browser is written here:
2. Before you start reading the article, pay attention to our navigator for the most useful resource for
To understand what will be written here, you need to know well what a quadratic function is and what it is eaten with. If you consider yourself a pro at quadratic functions, welcome. But if not, you should read the thread.
Let's start with a small checks:
- What does a quadratic function look like in general form (formula)?
- What is the name of the chart quadratic function?
- How does the leading coefficient affect the graph of a quadratic function?
If you can answer these questions right off the bat, keep reading. If at least one question caused difficulties, go to.
So, you already know how to handle a quadratic function, analyze its graph and build a graph by points.
Well, here it is: .
Let's take a quick look at what they do. odds.
- The senior coefficient is responsible for the “steepness” of the parabola, or, in other words, for its width: the larger, the narrower (steeper) the parabola, and the smaller, the wider (flatter) parabola.
- The free term is the coordinate of the intersection of the parabola with the y-axis.
- And the coefficient is somehow responsible for the displacement of the parabola from the center of coordinates. Here's more about that now.
Why do we always start building a parabola? What is her distinguishing point?
This is vertex. And how to find the coordinates of the vertex, remember?
The abscissa is searched for by the following formula:
Like this: what more, topics to the left the top of the parabola moves.
The ordinate of a vertex can be found by substituting into the function:
Substitute yourself and count. What happened?
If you do everything right and simplify the resulting expression as much as possible, you get:
It turns out that the more modulo, topics higher will vertex parabolas.
Finally, let's move on to plotting.
The easiest way is to build a parabola starting from the top.
Example:
Plot the function.
Decision:
First, let's define the coefficients: .
Now let's calculate the vertex coordinates:
And now remember: all parabolas with the same leading coefficient look the same. So, if we build a parabola and move its vertex to a point, we get the graph we need:
Simple, right?
There is only one question left: how to quickly draw a parabola? Even if we draw a parabola with a vertex at the origin, we still have to build it point by point, which is long and inconvenient. But all parabolas look the same, maybe there is a way to speed up their drawing?
When I was at school, my math teacher told everyone to cut out a parabola-shaped stencil out of cardboard so they could draw it quickly. But you won’t be able to walk everywhere with a stencil, and they won’t be allowed to take it to the exam. So, we will not use foreign objects, but we will look for a pattern.
Consider the simplest parabola. Let's build it by points:

The rule here is this. If we move from the top to the right (along the axis) to, and upwards (along the axis) to, then we will get to the point of the parabola. Further: if from this point we move to the right by and up by, we will again get to the point of the parabola. Next: right on and up on. What's next? Right on and up on. And so on: move to the right, and to the next odd number up. Then we do the same with the left branch (after all, the parabola is symmetrical, that is, its branches look the same):

Great, this will help build any parabola from the vertex with the highest coefficient equal to. For example, we have learned that the vertex of a parabola is at a point. Construct (on your own, on paper) this parabola.
Built?
It should turn out like this:

Now we connect the obtained points:

That's all.
OK, well, now build only parabolas with?
Of course not. Now let's figure out what to do with them, if.
Let's consider some typical cases.

Great, we learned how to draw a parabola, now let's practice on real functions.
So, draw graphs of such functions:
Answers:


3. Top: .
Do you remember what to do if the senior coefficient is less?
We look at the denominator of the fraction: it is equal. So we'll move like this:
- right - up
- right - up
- right - up
and also to the left:

4. Top: .
Oh, what to do with it? How to measure cells if the vertex is somewhere between the lines?..
And we cheat. First, let's draw a parabola, and only then move its vertex to a point. Not even, let's do it even more tricky: Let's draw a parabola, and then move axes:- on the down, a - on right:

This technique is very convenient in the case of any parabola, remember it.
Let me remind you that we can represent the function in this form:
For example: .
What does this give us?
The fact is that the number that is subtracted from in brackets () is the abscissa of the vertex of the parabola, and the term outside the brackets () is the ordinate of the vertex.
This means that, having built a parabola, you just need to move the axis to the left and the axis to down.
Example: let's plot a function graph.
Let's select a full square:
What number subtracted from in brackets? This (and not how you can decide without thinking).
So, we build a parabola:

Now we shift the axis down, that is, up:

And now - to the left, that is, to the right:

That's all. This is the same as moving a parabola with its vertex from the origin to a point, only the straight axis is much easier to move than a crooked parabola.
Now, as usual, myself:
And do not forget to erase the old axles with an eraser!
I am as answers for verification, I will write you the ordinates of the vertices of these parabolas:
Did everything fit?
If yes, then you are great! Knowing how to handle a parabola is very important and useful, and here we have found that it is not difficult at all.
GRAPHING A QUADRATIC FUNCTION. BRIEFLY ABOUT THE MAIN
quadratic function is a function of the form, where, and are any numbers (coefficients), is a free member.
The graph of a quadratic function is a parabola.
Top of the parabola:
, i.e. the larger \displaystyle b , the more left the top of the parabola moves.
Substitute in the function, and get:
, i.e. the greater \displaystyle b modulo , the higher the top of the parabola will be
The free term is the coordinate of the intersection of the parabola with the y-axis.
Well, the topic is over. If you are reading these lines, then you are very cool.
Because only 5% of people are able to master something on their own. And if you have read to the end, then you are in the 5%!
Now the most important thing.
You've figured out the theory on this topic. And, I repeat, it's ... it's just super! You are already better than the vast majority of your peers.
The problem is that this may not be enough ...
For what?
For successful passing the exam, for admission to the institute on the budget and, MOST IMPORTANTLY, for life.
I will not convince you of anything, I will just say one thing ...
People who received a good education, earn much more than those who did not receive it. This is statistics.
But this is not the main thing.
The main thing is that they are MORE HAPPY (there are such studies). Perhaps because much more opportunities open up before them and life becomes brighter? Don't know...
But think for yourself...
What does it take to be sure to be better than others on the exam and be ultimately ... happier?
FILL YOUR HAND, SOLVING PROBLEMS ON THIS TOPIC.
On the exam, you will not be asked theory.
You will need solve problems on time.
And, if you haven’t solved them (LOTS!), you will definitely make a stupid mistake somewhere or simply won’t make it in time.
It's like in sports - you need to repeat many times to win for sure.
Find a collection anywhere you want necessarily with solutions detailed analysis and decide, decide, decide!
You can use our tasks (not necessary) and we certainly recommend them.
In order to get a hand with the help of our tasks, you need to help extend the life of the YouClever textbook that you are currently reading.
How? There are two options:
- Unlock access to all hidden tasks in this article -
- Unlock access to all hidden tasks in all 99 articles of the tutorial - Buy a textbook - 499 rubles
Yes, we have 99 such articles in the textbook and access to all tasks and all hidden texts in them can be opened immediately.
Access to all hidden tasks is provided for the entire lifetime of the site.
In conclusion...
If you don't like our tasks, find others. Just don't stop with theory.
“Understood” and “I know how to solve” are completely different skills. You need both.
Find problems and solve!
Everyone knows what a parabola is. But how to use it correctly, competently in solving various practical problems, we will understand below.
First, let us denote the basic concepts that algebra and geometry give to this term. Consider everything possible types this chart.
We learn all the main characteristics of this function. Let's understand the basics of constructing a curve (geometry). Let's learn how to find the top, other basic values of the graph of this type.
We will find out: how the required curve is correctly constructed according to the equation, what you need to pay attention to. Let's see the main practical use this unique value in human life.
What is a parabola and what does it look like
Algebra: This term refers to the graph of a quadratic function.

Geometry: This is a second-order curve that has a number of specific features:

Canonical parabola equation
The figure shows a rectangular coordinate system (XOY), an extremum, the direction of the function drawing branches along the abscissa axis.
The canonical equation is:
y 2 \u003d 2 * p * x,
where the coefficient p is the focal parameter of the parabola (AF).
In algebra, it is written differently:
y = a x 2 + b x + c (recognizable pattern: y = x 2).
Properties and Graph of a Quadratic Function
The function has an axis of symmetry and a center (extremum). The domain of definition is all values of the x-axis.

The range of values of the function - (-∞, M) or (M, +∞) depends on the direction of the curve branches. The parameter M here means the value of the function at the top of the line.
How to determine where the branches of a parabola are directed
To find the direction of this type of curve from an expression, you need to specify the sign in front of the first parameter algebraic expression. If a ˃ 0, then they are directed upwards. Otherwise, down.
How to find the vertex of a parabola using the formula
Finding the extremum is the main step in solving many practical problems. Of course, you can open special online calculators but it's better to be able to do it yourself.

How to define it? There is a special formula. When b is not equal to 0, we must look for the coordinates of this point.
Formulas for finding the top:
- x 0 \u003d -b / (2 * a);
- y 0 = y (x 0).
Example.
There is a function y \u003d 4 * x 2 + 16 * x - 25. Let's find the vertices of this function.
For such a line:
- x \u003d -16 / (2 * 4) \u003d -2;
- y = 4 * 4 - 16 * 2 - 25 = 16 - 32 - 25 = -41.
We get the coordinates of the vertex (-2, -41).
Parabola offset
The classic case is when in a quadratic function y = a x 2 + b x + c, the second and third parameters are 0, and = 1 - the vertex is at the point (0; 0).

Movement along the abscissa or ordinate axes is due to a change in the parameters b and c, respectively. The shift of the line on the plane will be carried out exactly by the number of units, which is equal to the value of the parameter.
Example.
We have: b = 2, c = 3.
This means that the classic view of the curve will shift by 2 unit segments along the abscissa axis and by 3 along the ordinate axis.
How to build a parabola using a quadratic equation
It is important for schoolchildren to learn how to correctly draw a parabola according to the given parameters.

By analyzing expressions and equations, you can see the following:
- The point of intersection of the desired line with the ordinate vector will have a value equal to c.
- All points of the graph (along the x-axis) will be symmetrical with respect to the main extremum of the function.
In addition, the intersections with OX can be found by knowing the discriminant (D) of such a function:
D \u003d (b 2 - 4 * a * c).
To do this, you need to equate the expression to zero.
The presence of parabola roots depends on the result:
- D ˃ 0, then x 1, 2 = (-b ± D 0.5) / (2 * a);
- D \u003d 0, then x 1, 2 \u003d -b / (2 * a);
- D ˂ 0, then there are no points of intersection with the vector OX.
We get the algorithm for constructing a parabola:
- determine the direction of the branches;
- find the coordinates of the vertex;
- find the intersection with the y-axis;
- find the intersection with the x-axis.
Example 1
Given a function y \u003d x 2 - 5 * x + 4. It is necessary to build a parabola. We act according to the algorithm:
- a \u003d 1, therefore, the branches are directed upwards;
- extremum coordinates: x = - (-5) / 2 = 5/2; y = (5/2) 2 - 5 * (5/2) + 4 = -15/4;
- intersects with the y-axis at the value y = 4;
- find the discriminant: D = 25 - 16 = 9;
- looking for roots
- X 1 \u003d (5 + 3) / 2 \u003d 4; (4, 0);
- X 2 \u003d (5 - 3) / 2 \u003d 1; (ten).
Example 2
For the function y \u003d 3 * x 2 - 2 * x - 1, you need to build a parabola. We act according to the above algorithm:
- a \u003d 3, therefore, the branches are directed upwards;
- extremum coordinates: x = - (-2) / 2 * 3 = 1/3; y = 3 * (1/3) 2 - 2 * (1/3) - 1 = -4/3;
- with the y-axis will intersect at the value y \u003d -1;
- find the discriminant: D \u003d 4 + 12 \u003d 16. So the roots:
- X 1 \u003d (2 + 4) / 6 \u003d 1; (1;0);
- X 2 \u003d (2 - 4) / 6 \u003d -1/3; (-1/3; 0).
From the obtained points, you can build a parabola.
Directrix, eccentricity, focus of a parabola

Based on the canonical equation, the focus F has coordinates (p/2, 0).
Straight line AB is a directrix (a kind of parabola chord of a certain length). Her equation is x = -p/2.

Eccentricity (constant) = 1.
Conclusion
We considered the topic that students study in high school. Now you know, looking at the quadratic function of a parabola, how to find its vertex, in which direction the branches will be directed, whether there is an offset along the axes, and, having a construction algorithm, you can draw its graph.
We also recommend
 Switching power supply: repair and refinement
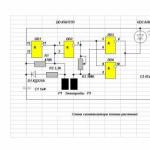
 Remote control of light
 Swimming lessons for preschool children
 Notes for the master - home household alarms
 Clock propeller on Atmega8
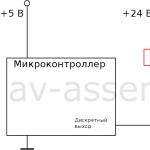 Device and relay application examples, how to choose and connect a relay correctly Microcontroller and relay simple switching circuits