Graph of the function y cosine x 2. Presentation for an algebra lesson (grade 10) on the topic: Functions y \u003d sin x and y \u003d cos x and their graphs
In this lesson, we will consider in detail the function y \u003d cos x, its main properties and graph. At the beginning of the lesson, we will give the definition of the trigonometric function y \u003d cost on the coordinate circle and consider the graph of the function on the circle and line. Let's show the periodicity of this function on the graph and consider the main properties of the function. At the end of the lesson, we will solve some simple problems using the graph of the function and its properties.
Topic: Trigonometric functions
Lesson: Function y=cost, its main properties and graph
A function is a law according to which each value of an independent argument is assigned a unique value of the function.
Let's remember function definition Let be t- any real number. It corresponds to a single point M on the number circle. At the point M there is only one abscissa. It's called the cosine of the number. t. Each argument value t corresponds to only one value of the function (Fig. 1).

The central angle is numerically equal to the size of the arc in radians, i.e. number Therefore, the argument can be either a real number or an angle in radians.
If we can determine for each value, then we can graph the function
You can get the graph of the function in another way. According to the reduction formulas ![]() so the cosine plot is a sinusoid shifted along the axis x to the left (Fig. 2).
so the cosine plot is a sinusoid shifted along the axis x to the left (Fig. 2).

Function Properties
1) Domain of definition:
2) Range of values: ![]()
3) The function is even:
4) The smallest positive period:
5) Coordinates of points of intersection with the abscissa axis:
6) Coordinates of the point of intersection with the y-axis:
7) Intervals on which the function takes positive values:
8) Intervals at which the function takes negative values:
9) Increasing intervals:
10) Descending intervals:
11) Low points: ![]()
12) Minimum function: .
13) High points: ![]()
14) Maximum features:
We have considered the main properties and the graph of the function. Further, they will be used in solving problems.
Bibliography
1. Algebra and the beginning of analysis, grade 10 (in two parts). Tutorial for educational institutions(profile level) ed. A. G. Mordkovich. -M.: Mnemosyne, 2009.
2. Algebra and the beginning of analysis, grade 10 (in two parts). Task book for educational institutions (profile level), ed. A. G. Mordkovich. -M.: Mnemosyne, 2007.
3. Vilenkin N.Ya., Ivashev-Musatov O.S., Shvartsburd S.I. Algebra and mathematical analysis for grade 10 ( tutorial for students of schools and classes with in-depth study of mathematics).-M .: Education, 1996.
4. Galitsky M.L., Moshkovich M.M., Shvartsburd S.I. An in-depth study of algebra and mathematical analysis.-M .: Education, 1997.
5. Collection of problems in mathematics for applicants to technical universities (under the editorship of M.I.Skanavi).-M.: Higher school, 1992.
6. Merzlyak A.G., Polonsky V.B., Yakir M.S. Algebraic trainer.-K.: A.S.K., 1997.
7. Sahakyan S.M., Goldman A.M., Denisov D.V. Tasks in Algebra and the Beginnings of Analysis (a manual for students in grades 10-11 of general educational institutions).-M .: Education, 2003.
8. Karp A.P. Collection of problems in algebra and the beginnings of analysis: textbook. allowance for 10-11 cells. with a deep study mathematics.-M.: Education, 2006.
Algebra and the Beginnings of Analysis, Grade 10 (in two parts). Task book for educational institutions (profile level), ed. A. G. Mordkovich. -M.: Mnemosyne, 2007.
№№ 16.6, 16.7, 16.9.
Additional web resources
3. Educational portal to prepare for exams ().
To use the preview of presentations, create an account for yourself ( account) Google and sign in: https://accounts.google.com
Slides captions:
Functions y \u003d sin x and y \u003d cos x and their graphs (accompanying presentation for the lesson) TATYANA SERGEEVNA KORPUSOVA teacher of mathematics MBOU LSOSH No. N.F.Struchenkova Bryansk region
DEFINITION Numerical functions given by the formulas y \u003d sin x and y \u003d cos x, respectively, are called sine and cosine. 10.11.2013 Korpusova T.S.
Function y=sin x , graph and properties. 10.11.2013 Korpusova T.S.
Sinusoid y 1 - π / 2 π 2 π 3 π x -3 π / 2 - π 0 π / 2 3 π / 2 5 π / 2 -1 10.11.2013 KORPUSOVA T.S.
y \u003d sin (x + a) EXAMPLE y 1 -1 π 2 π - π 10.11.2013 Korpusova T.S.
y \u003d sin x + a 1) y \u003d sin x + 1; y 1 x - π 0 π 2 π x -1 x 2) y = sin x - 1
Plotting y=sin(x+m)+l y 1 - π 0 π 2 π 3 π x -1 10.11.2013 Korpusova T.S.
Function y = cos x , its properties and graph. 10.11.2013 Korpusova T.S.
y \u003d cos x y 1 - π / 2 π 2 π 3 π x - π 0 π / 2 3 π / 2 5 π / 2 -1 Korpusova T.S.
Plotting y = cos (x+m)+l 1)y =- cos x; y 2 y x 0 x -1 2)y= cos (x- π/4)+2 10.11.2013 Korpusova T.S.
Plotting y=k sin x y 2.5 1 x -1 -2.5 10.11.2013 Korpusova T.S.
Finding a Period trigonometric functions If y=f(x) is periodic and has the smallest positive period T₁, then the function y=A f(kx+b), where A, k and b are constants, and k ≠ 0 , is also periodic with period Examples: 11/10/2013 Korpusova T.S. 1) y=sin 6 x +2, T₁=2 π T₁=2 π
Plotting periodic functions November 10, 2013 Korpusova T.S. y x 1 1 y x 1 1 1)T= 4 2)T= 4 Given a function y= f(x) . Plot its graph if the period is known. y x 1 1 3)T= 3
Construct a graph of the function: y=2cos(2x- π/3)-0.5 and find the domain of definition and the range of values of the function 10.11.2013 Korpusova T.S. y x 1 -1 π - π 2 π -2 π T= π


 Back forward
Attention! The slide preview is for informational purposes only and may not represent the full extent of the presentation. If you are interested this work please download the full version.
Lesson topic: “Function y=cosx”
Lesson #1
Lesson Objectives: To introduce students to the properties of a function
Lesson objectives.
Educational - the formation of functional representations on visual material, the formation of the ability to plot graphs of the function y \u003d cosx, to form the skills of free reading of graphs, the ability to reflect the properties of the function on the graph.
During the classes
| № | Lesson stage | Slideshow | Time |
| 1 | Organizing time. Greetings | ||
| 2 | Announcement of the topic and purpose of the lesson | ||
| 3 | Updating of basic knowledge Doing oral exercises. |
Frontal survey |
|
| 4 | Presentation of new material The task of plotting y \u003d cosx on a segment Discussion of the properties of the function y = cosx on a segment The task of constructing a sketch of the graph of the function y \u003d cosx Discussion of the properties of the function y = cosx |
Entering properties into a table |
|
| 5 | Solving problems according to the textbook No. 708, No. 709 |
The decision is accompanied by slide number 4 | |
| 6 | The task of plotting a graph of a function with a shift along the ordinate axis and along the abscissa axis. Function property discussion |
||
| 7 | Independent work according to the textbook | №710 (1;3), №711 (1;3), №711 (1;3) |
|
| Summarizing. Lesson results. Grading. |
|||
| 9 | Homework | §40 #710(2;4), #711(2;4), #711(2;4). Construct graphs of functions y \u003d cosx on and describe the properties of this function. Extra #717 (1) |
The purpose of the lesson: To acquaint students with the properties of the function y \u003d cosx, learning to plot the graph of the function y \u003d cosx, reading this graph, using the properties and graph of the function when solving equations and inequalities.
2. The announcement of the topic and purpose of the lesson is accompanied by slide number 2
3. Actualization of basic knowledge
Doing oral exercises.
- Repeat the definition of trigonometric functions and the signs of the values of these functions.
- Draw students' attention to the fact that for any real number you can specify the corresponding point on the unit circle, and hence its abscissa and ordinate, i.e. cosine and sine of the number x: y \u003d cosx and y \u003d sinx, the domain of definition of which is all real numbers.
Then students answer the questions:
- At what values of x does the function y=cosx take on a value equal to 0? one? -one?
- Can the function y=cosx take a value greater than 1, less than -1?
- At what values of x does the function y=cosx take on the largest (smallest) value?
- What is the set of values of the function y=cosx?
The answers to these and the following questions are accompanied by an illustration on a unit circle.
Having repeated the signs of the values of trigonometric functions in each quarter of the coordinate plane, students are asked to show several points of the unit circle corresponding to numbers whose cosine is a positive (negative) number. Then answer the questions:
1) What is the sign of the function y \u003d cosx, if x \u003d, x \u003d,
0<х<, 0<х<, <х<, <х<2.5?
2) Indicate several values of x, at which the values of the function y \u003d cosx are positive, negative.
3) Is it possible to name all the values of a number whose cosine is positive, negative?
4) Is it possible to name all the values of the argument x for which the values of the function y = cosx are positive or negative?
5) Even or odd function y = cosx.
6) What is the period of this function?
4. Presentation of new material.
Generalization and concretization of the knowledge obtained earlier: the study of the domain of definition, the set of values, parity, periodicity allows you to build a graph first on the segment, then on the segment, and then on the entire number line. The explanation is accompanied by slide #3.
Then students learn to draw a sketch of the graph of the function y \u003d cosx at points (0; 1), (; 0),
(:-1), (;0), (;1) and generalize the properties of the function by writing them to a table.
We check with the help of slide number 4.
(At this stage, supporting notes are issued (Appendix 1))
5. Consolidation of primary knowledge.
With the help of a sketch of the graph of the function y \u003d cosx, students answer questions No. 708, using the property table of the function y \u003d cosx they answer questions No. 709
6. The task of plotting a function graph with a shift along the ordinate axis and along the abscissa axis.
1. Slide number 5, 6
During the conversation, the properties of these functions are discussed.
7. Independent work on the textbook
№710(1;3), №711(1;3), №711(1;3), №710
Divide this segment into two segments so that the function y \u003d cosx increases on one of them, and decreases on the other:
Decreases; - increases
Decreases; - increases
Using the increasing or decreasing property of the function y \u003d cosx, compare the numbers:
On the segment, the function y \u003d cosx decreases; , hence, .
On the segment, the function y \u003d cosx increases;
<, следовательно, cos < cos
Find all roots of the equation belonging to the segment:
1) cosx \u003d x \u003d ± +2 n, n Z
Answer: ; ; .
2) cosx = - x = ± ![]()
8. Summing up.
Grading.
In the lesson, we learned how to graph the function y = cosx, read the properties of this graph, build a sketch of the graph, solve problems related to using the graph and the properties of the function y = cosx.
9. Homework.
§40 #710(2;4), #711(2;4), #711(2;4). Construct graphs of functions y \u003d cosx on and describe the properties of this function.
Additionally No. 717(1).
Topic: “Function y=cosx”
Lesson #2
Lesson objectives: Repeat the rules for constructing a graph of a function y \u003d cosx, learn how to apply graph transformation techniques, read this graph, use the properties and graph of a function when solving equations and inequalities.
Lesson objectives.
Educational - the formation of functional representations on visual material, the formation of the ability to plot graphs of the function y \u003d cosx with various transformations, to form the skills of free reading of graphs, the ability to reflect the properties of a function on a graph.
Developing - the formation of the ability to analyze, generalize the knowledge gained. Formation of logical thinking.
Educational - to activate interest in acquiring new knowledge, educating a graphic culture, forming accuracy and accuracy when making drawings.
Equipment: multimedia projector, screen, Microsoft Windows 98/Me/2000/XP operating system, MS Office 2003: Power Point, Microsoft Word, Microsoft Excel.
During the classes
| № | Lesson stage | Slideshow | Time |
| 1 | Organizing time. Greetings | 1 | |
| 2 | Announcement of the topic and purpose of the lesson | 2 | |
| 3 | Checking homework | №717(1), Slide №7 |
5 |
| 4 | Presentation of new material The task of plotting a graph by squeezing and stretching to the OX axis Discussion of the properties of the function y =k cosx for k>1 and 0 The task of plotting a graph by squeezing and stretching to ori OU Discussion of the properties of the function y = cos(k x) for k>1 and 0 |
Slide №8, 9 |
12 |
| 5 | Consolidation of primary knowledge. Solving problems in the textbook №713(1;3), №715(1) №716(1) |
No. 717 (2) textbook p. 208. When solving No. 715 (1), No. 716 (1), use the constructed graph of the function y \u003d cos2x. Slide #10 | 5 |
| 6 | The task is to plot a graph of a function that is symmetrical about the x-axis. 1. Organizational moment. Greetings. 2. The announcement of the topic and purpose of the lesson is accompanied by slide number 2. 3. Checking homework 4. Presentation of new material 1. The task of plotting a graph by squeezing and stretching to the OX axis. Discussion of the properties of the function y =k cosx for k>1 and 0 slide number 8 2. The task of plotting a graph by squeezing and stretching to the y-axis. Discussion of the properties of the function y = cos(kx) for k>1 and 0 slide number 9 5. Consolidation of primary knowledge Solving problems according to the textbook No. 713 (1; 3), No. 715 (1) No. 716 (1) Task No. 715 (1) No. 716 (1) is checked using slide No. 10 6. The task of plotting a graph of a function symmetrical about the x-axis Function property discussion .
Slide number 11 (use the reference outline (Appendix 1)) 7. Independent work Solution of test problems .
(Half of the students solve tests in XL (Appendix 2), at computers, the second half on handouts (Appendix 3). Then the students change places.) 8. The results of the lesson. As a result of studying the topic, students learned how to graph the function y \u003d cosx, read the properties of the function, build graphs of the function using various transformations, read the properties of graphs with transformations, solve simple problems using graphs and properties of the function y \u003d cosx. Grading. 9. Homework. §40 #717(3), #713(4), #715(4), #716(2). Additionally No. 719(2) (Check slide No. 13) At the beginning of the next lesson, you can invite students to work on building graphs on ready-made handouts ( |
Lesson and presentation on the topic: "Function y=cos(x). Definition and graph of a function"
Additional materials
Dear users, do not forget to leave your comments, feedback, suggestions. All materials are checked by an antivirus program.
Teaching aids and simulators in the online store "Integral" for grade 10
Algebraic problems with parameters, grades 9–11
Software environment "1C: Mathematical constructor 6.1"
What will we study:
1. Definition.
2. Graph of the function.
3. Properties of the function Y=cos(X).
4. Examples.
Definition of the cosine function y=cos(x)
Guys, we have already met with the Y=sin(X) function.
Let's remember one of the ghost formulas: sin(X + π/2) = cos(X).
Thanks to this formula, we can assert that the functions sin(X + π/2) and cos(X) are identical, and their function graphs are the same.
The graph of the sin(X + π/2) function is obtained from the graph of the sin(X) function by parallel shifting π/2 units to the left. This will be the graph of the function Y=cos(X).
The graph of the function Y=cos(X) is also called a sinusoid.
cos(x) function properties
- Let's write the properties of our function:
- The domain of definition is the set of real numbers.
- The function is even. Let's recall the definition of an even function. A function is called even if the equality y(-x)=y(x) holds. As we remember from the ghost formulas: cos(-x)=-cos(x), the definition is fulfilled, then the cosine is an even function.
- The function Y=cos(X) decreases on the interval and increases on the interval [π; 2π]. We can verify this on the graph of our function.
- The function Y=cos(X) is bounded from below and above. This property comes from the fact that
-1 ≤ cos(X) ≤ 1 - The smallest value of the function is -1 (for x = π + 2πk). The largest value of the function is 1 (for x = 2πk).
- The function Y=cos(X) is a continuous function. Let's look at the graph and make sure that our function has no gaps, which means continuity.
- The range of values is the segment [- 1; one]. This is also clearly visible from the graph.
- The function Y=cos(X) is a periodic function. Let's look at the graph again and see that the function takes on the same values at some intervals.
Examples with the cos(x) function
1. Solve the equation cos(X)=(x - 2π) 2 + 1
Solution: Let's build 2 graphs of the function: y=cos(x) and y=(x - 2π) 2 + 1 (see figure). _2.jpg)
y \u003d (x - 2π) 2 + 1 is a parabola shifted to the right by 2π and up by 1. Our graphs intersect at one point A (2π; 1), this is the answer: x \u003d 2π.
2. Plot the function Y=cos(X) for x ≤ 0 and Y=sin(X) for x ≥ 0
Solution: To build the required graph, let's plot two graphs of the function piece by piece. First slice: y=cos(x) for x ≤ 0. Second slice: y=sin(x)
for x ≥ 0. Let's depict both "pieces" on one graph.
_3.jpg)
3. Find the largest and smallest value function Y=cos(X) on the segment [π; 7π/4]
Solution: Let's build a graph of the function and consider our segment [π; 7π/4]. The graph shows that the largest and smallest values are achieved at the ends of the segment: at the points π and 7π/4, respectively.
Answer: cos(π) = -1 is the smallest value, cos(7π/4) = the largest value.
_4.jpg)
4. Plot the function y=cos(π/3 - x) + 1
Solution: cos(-x)= cos(x), then the desired graph will be obtained by moving the graph of the function y=cos(x) π/3 units to the right and 1 unit up.
_5.jpg)
Tasks for independent solution
1) Solve the equation: cos (x) \u003d x - π / 2.2) Solve the equation: cos(x)= - (x - π) 2 - 1.
3) Plot the function y=cos(π/4 + x) - 2.
4) Plot the function y=cos(-2π/3 + x) + 1.
5) Find the largest and smallest value of the function y=cos(x) on the segment .
6) Find the largest and smallest value of the function y=cos(x) on the interval [- π/6; 5π/4].
We also recommend
 Switching power supply: repair and refinement
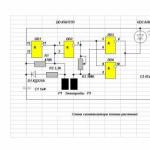
 Remote control of light
 Swimming lessons for preschool children
 Notes for the master - home household alarms
 Clock propeller on Atmega8
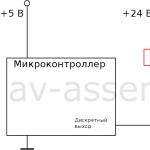 Device and relay application examples, how to choose and connect a relay correctly Microcontroller and relay simple switching circuits