3.2. CUSTOMER SATISFACTION INDICES
Methods for determining consumer satisfaction indices
The development of the integral value of the product into generalized and detailed consumer expectations is called customer satisfaction tree.
Indexing the degree of consumer satisfaction allows you to quantify the contribution to the general opinion of the consumer about the quality of the object, various components.
As a rule, the standard five-point scale is taken as the basis for the determination methods (very familiar from school and naturally from institute practice).
The value of the components is determined by the table:
Characteristics of quality objects:
Services:
The quality of the components (tree component) is determined by the scheme:
| The degree of consumer satisfaction with the quality of execution of each component of the tree | Grade | score | Consumer Satisfaction Index | Three Ways to Present Survey Results | ||
| a | b | c | ||||
Completely dissatisfied | Badly | 1 | (1) | 0 | 20 | The absolute number of consumers who gave ratings of 5 and 4. |
Dissatisfied | Failed | 2 | 25 | 40 | ||
Neutral | Oud. | 3 | (2) | 50 | 60 | |
| Good | 4 | (3) | 75 | 80 | ||
Completely satisfied | Fine | 5 | 100 | 100 | ||
How many people answered how they rate "reliability", etc.
All surveys are conducted among the so-called. “external consumers” (remember what “external” and “internal” mean?)
So: "external consumer" can be represented by three main groups.
Typically, consumers are asked to rate the weight (in terms of points) of each entry (component) of the tree. In the tree picture, the opinion of consumers about a particular component is shown as a percentage. Based on the results, the company adjusts not only the work to improve the quality of the product or services, but also the strategy to achieve the main goal - the maximum value of the product for the consumer and its minimum cost for both parties.
Rice. external customers of the company.
For greater clarity, the statistical results of the study of consumer satisfaction can be represented as a map of consumer satisfaction profiles, on the abscissa axis of which the components of the tree are applied, and on the ordinate axis - the opinion of consumers about these components (the average value of their assessment, expressed as a percentage).
Similar maps can be built for each group of homogeneous consumers corresponding to a certain market sector.
They are very useful for comparative analysis.
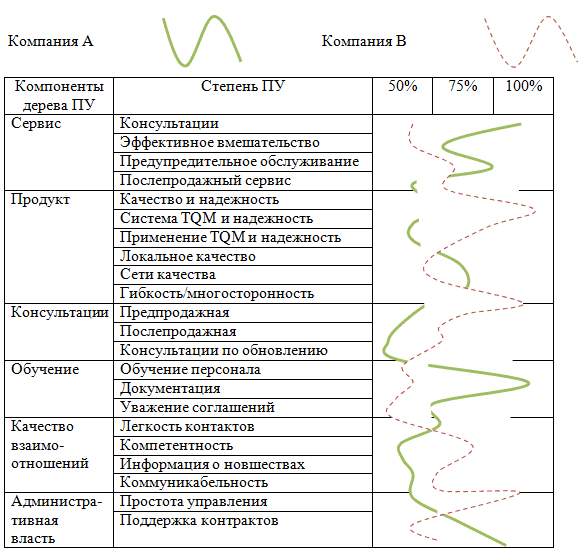
Rice. PU profile map.
European consumer satisfaction index.
The European Consumer Satisfaction Index is considered to be one of the important outcomes of European quality promotion policies that promote competitiveness and economic growth at both the macro and micro levels.
At the micro level - the UE index shows the most important asset of the company - customer value.
Any PM index is usually designed so that its emphasis is on supporting macroeconomic policy. In particular, the PM index allows assessing the real structure of competition, choosing the economic principles of structural transformations aimed at strengthening competitiveness, and evaluating economic indicators in a broader sense.
Europe has some experience in using national indices. In particular, in 1989 the so-called Swedish "barometer" UP was introduced, and since 1992 - the German "barometer" of consumption. They are also being developed in Austria, Denmark, France and Italy.
The barometer model is based on three levels:
- the first deals with the forces driving customer satisfaction (various aspects of the consumer's understanding of quality, expectations, price, etc.);
- the second - issues weighted in the PM index;
- the third - some indicators representing exclusively the results of customer satisfaction (for example, loyalty).
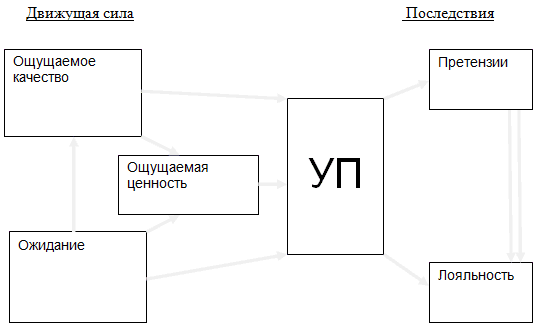
Rice. PU profile map.
National PM indices being introduced today mostly follow this model.
| For questions: [email protected] website |